Page Views Drilldown
The last section under the Analyze tab is Page Views.
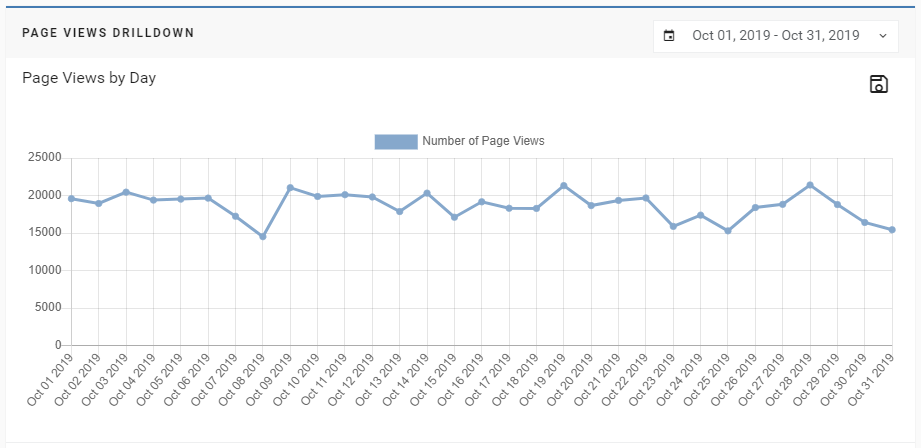
- The default view for the Page Views section will show you the number of page views every day for the last month.
- You can change the date to view a different time period on the graph.
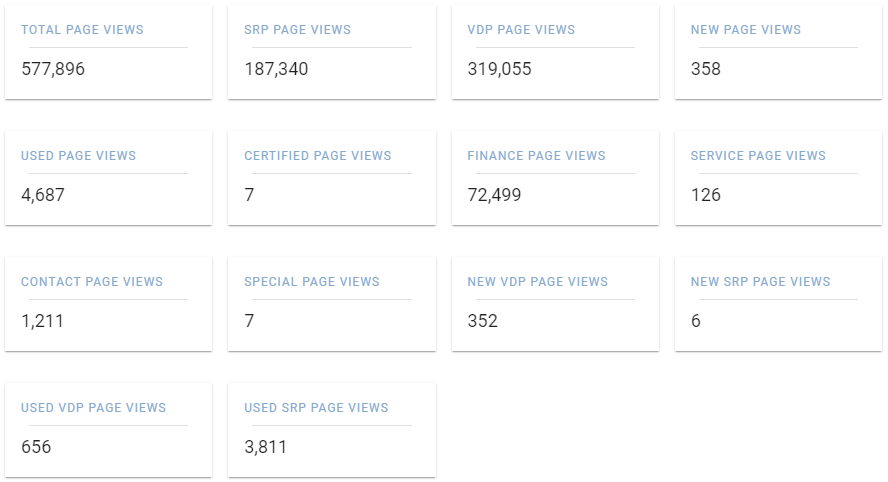
- Below the graph, there will be specific metric numbers for page views.
- By clicking on the name of the metric, you will be able to filter the table below the metric cards and see the specific data from that metric.
- To filter out specific Page Views Details, click the right funnel and then click + New Filter and select your filter(s).
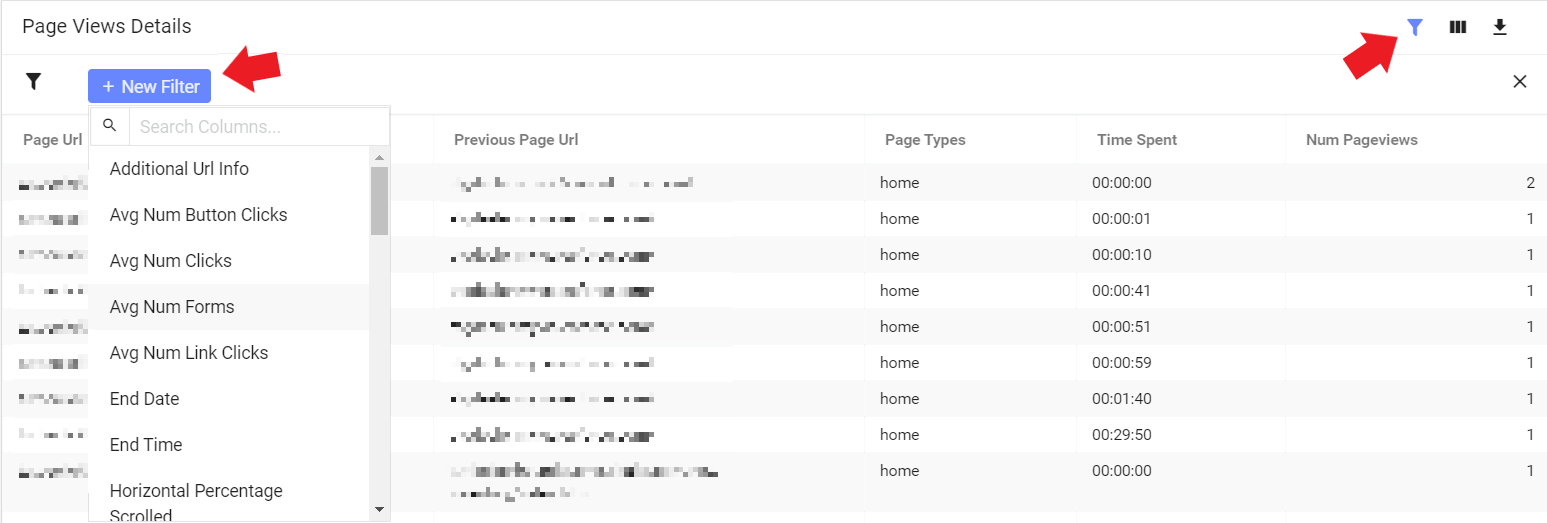
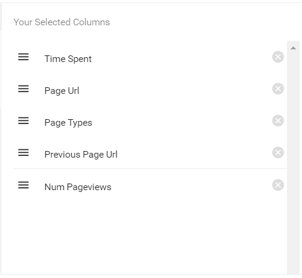
- To customize your columns for Page Views Details, click the three columns icon on the top right side of the table and select Customize Columns.

- On the right side of the customize columns section, you can change the order of the selected columns by dragging the selection up or down.
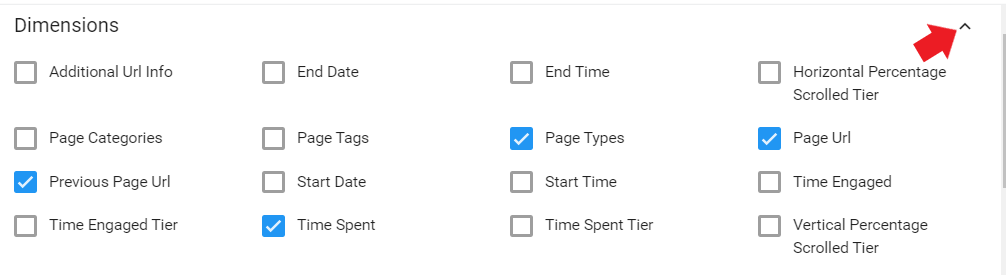
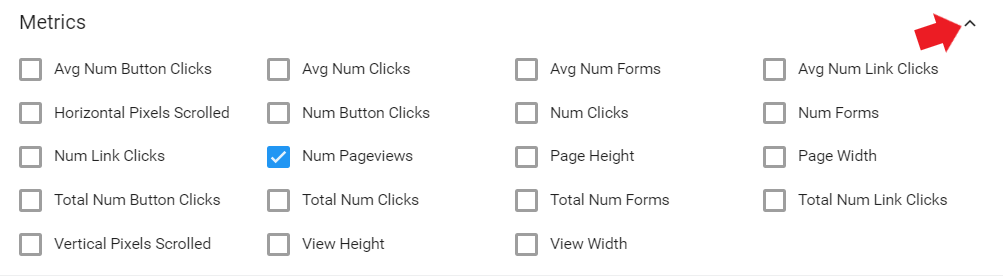
- To change the Dimensions or Metrics, click the top right arrow (shown near the red arrow) to open up the options and check (or uncheck) those you want to use.
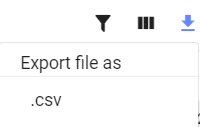
- To export the data table into a Microsoft Excel file, click the download icon and it should drop down a menu and you will click "Export file as .csv."
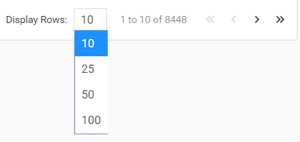
- To change the number of rows, click the drop-down menu near Display Rows.
- You can change the page forward and backward by pressing < or >.
- You can also go to the first page by pressing << or go to the last page by pressing >>.
Last Updated: Dec 9, 2019 2:41 PM
Now that we are done with the entire Analyze tab, the next important tab in the Orbee Platform is the Conversions tab.