
Dealerships can use this report to evaluate the effectiveness of their marketing strategies, identify potential issues with bot traffic inflating metrics, and ensure a more accurate understanding of visitor engagement and regional performance.
The data can guide improvements in traffic filtering, campaign targeting, and resource allocation.
‼️Because of the size of the data being pulled, there can be delays in load times for the report. Multiple refresh attempts may be necessary in these cases.
‼️It’s important to ensure that all expected traffic sources are tagged properly for accurate reporting. Most sources will have auto-tagging features available, but it’s good practice to check with your partners to ensure proper tagging even in manual tagging cases.
View the Report
- Sign in to Orbee
- From the top menu, select Analytics
- On the left, scroll down to Dashboards and select Bot and Live Web Traffic and Location Analysis
Setting Up Bot Detection
Before generating reports, ensure the Bot Detection feature is properly configured by reaching out to your Customer Success Manager or support@orbee.com.
- Log in to your Orbee Platform account.
- Navigate to the Bot Detection Dashboard Orbee Platform > Dynamic Reports > Dashboards > Automated Web Traffic and Location Analysis
.png?width=688&height=294&name=unnamed%20(31).png)
Note: When choosing your date range, it's best to limit it to a maximum of one month. Due to the large amount of data involved, longer periods may cause the report to take a long time to generate or even fail to run.
Where the data comes from
The Bot and Live Web Traffic and Location Analysis is sourced from Orbee First Party data or website data. This is the data that is collected via the Orbee script that is injected onto your website and within (vendor-approved) digital retailing tools and iframes.
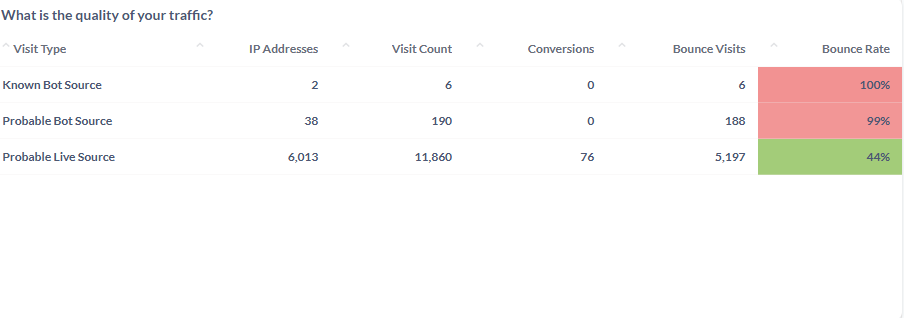
What is the quality of your traffic?
This chart breaks down visit types (bot, probable bot, probable live) alongside key metrics like IP count, visits, conversions, and bounce rates. Dealerships can identify traffic quality issues and refine marketing strategies to reduce bot interference.
Visit type distribution
A pie chart showing the proportion of bot, probable bot, and live visits. It helps dealerships monitor overall traffic composition and assess whether their efforts are reaching genuine users.

Campaigns with Probable or Known Bot Traffic
This chart reveals the quality of traffic based on different campaign sources. It can highlight how much bot traffic is affecting each campaign’s performance. Dealerships can use this to adjust targeting and improve campaign efficiency.

Self-Declared Bot Source Names
A table that lists known web crawlers (e.g., Googlebot, Bingbot) and their visit counts. This can alert dealerships of SEO crawlers visiting their website and emphasizing the importance of following best SEO practices to rank better on search engines. Visit the Best SEO Practices for Search Engine Crawlers for guidance on managing these bots.

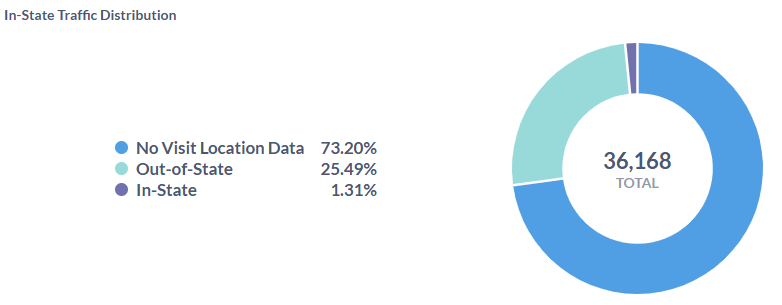
In-State Traffic Distribution
This chart compares in-state, out-of-state, and unknown-location traffic gives dealerships insights into their geographic reach and the effectiveness of local marketing.
Region Source Distribution
This chart displays state-by-state visit distributions enables dealerships to pinpoint regional engagement and prioritize high-performing areas.

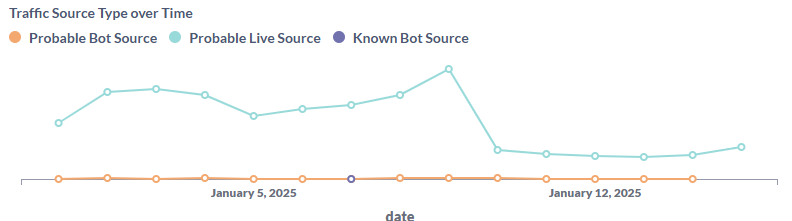
Traffic Source Type Over Time
This graph tracks daily trends for bot, probable bot, and live traffic. Dealerships can monitor fluctuations over time and adjust their strategies accordingly.
Location Origin Over Time
A graph showing daily trends in in-state, out-of-state, and no-location data helps dealerships track geographic shifts in visitor activity.

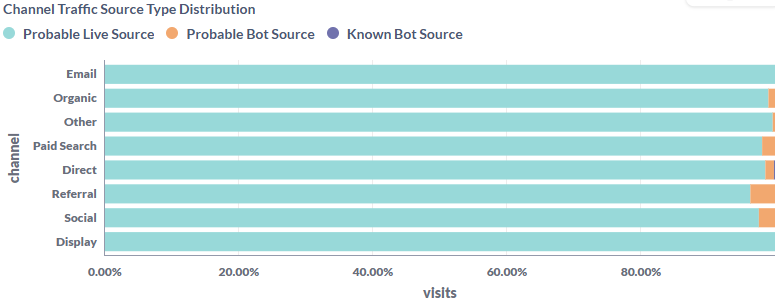
Channel Traffic Source Type Distribution
A graph displaying visit types (bot, probable bot, live) by channel helps dealerships evaluate channel-specific performance and optimize marketing efforts.
Location Traffic Source Type Distribution
This bar graph compares visit types (live, bot and probable bot) across channels, offering insights into how different types visit from regional or non-regional locations.

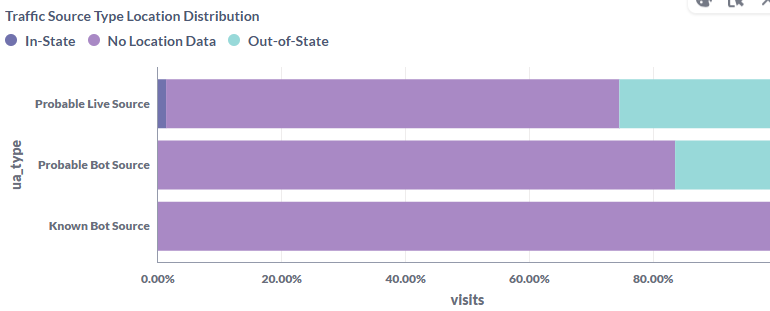
Traffic Source Type Location Distribution
A bar graph showing visit type (bot, probable bot, live) across location categories (in-state, out-of-state, no location) helps dealerships refine regional targeting and detect irregularities.
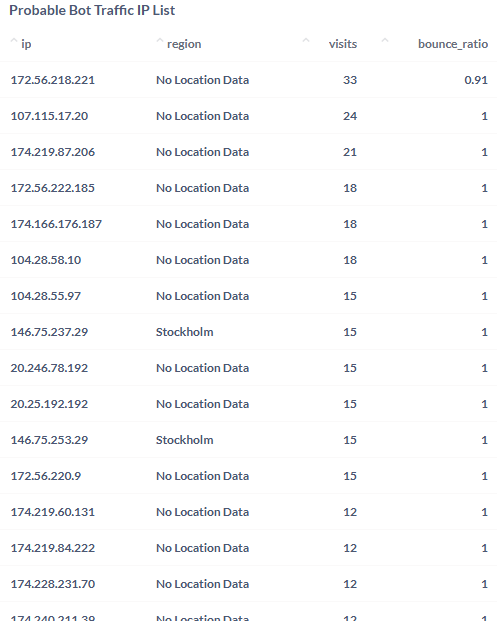
Probable Bot Traffic IP List
An exportable list detailing probable bot IPs, their regions, visit counts, and bounce ratios allows dealerships to block or monitor suspicious traffic sources.
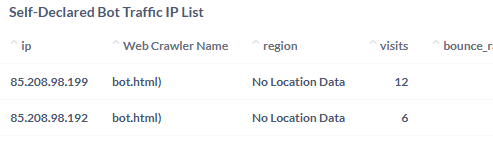
Self-Declared Bot Traffic IP List
This exportable list of declared bot IPs enables dealerships to exclude known automated traffic from analytics, ensuring data accuracy.
All Automated Traffic and Location Data
A raw data table, exportable for business analytics, supports detailed investigations into traffic behavior and aids in optimizing marketing campaigns.
2. Configuring Exclusions
- Exclude Specific Campaigns:
- If you want to exclude certain campaigns from the bot detection analysis (e.g., campaigns run by Orbee), add these campaigns to the exclusion list under the Campaign Exclusions tab.
3. Save and Test the Configuration
- Save your settings and run a test by monitoring traffic for a short period to ensure the parameters are working as expected.
- Adjust settings as necessary to refine bot detection accuracy.
Recommendations for Implementation
Blocking High-Volume Bot IPs:
Blacklist the most active IP addresses contributing to bot traffic. For example, blocking IPs from Ontario could potentially reduce bot traffic by up to 70%.
Monitor Regularly:
Regularly review the bot detection reports to stay ahead of new bot traffic patterns and adjust your strategies as necessary.
Focus on Real Traffic:
Prioritize optimizing campaigns for the states that bring in quality traffic, filtering out less productive regions identified as bot sources.
Interpreting the Report
After generating the report, here's how you can interpret the data:
Traffic Distribution
The report divides traffic into In-state, Out-of-state, and No Location Data categories. This helps you determine which states contribute to real traffic and adjust your marketing strategy accordingly.
Bot Traffic Insights
Analyze the source distribution to identify where bot traffic originates. For instance, in the case of `dealerdomain.com`, a significant portion of bot traffic came from Ontario, Canada. Blocking these IPs could significantly reduce non-productive traffic.
Campaign Performance
The report indicates that bot traffic primarily arrives directly via the site’s URL, with some coming from Google/CPCand remarketing ads. Fortunately, this does not seem to impact your ad costs.