Car Shoppers Analysis
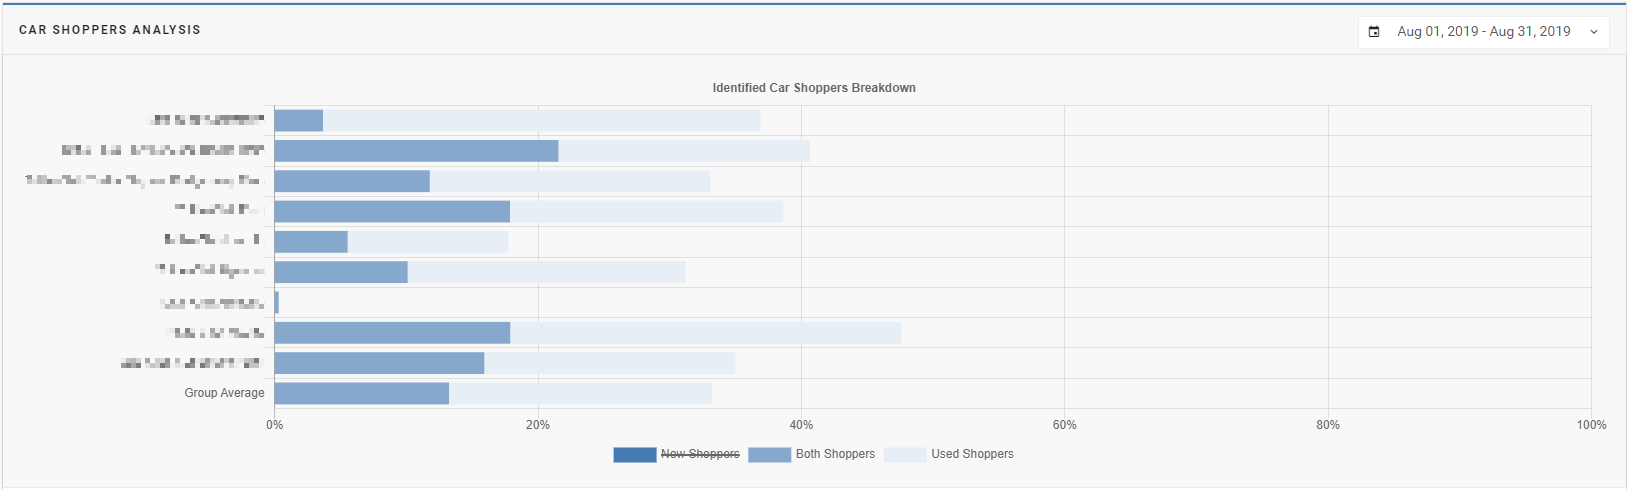
The Car Shopper Analysis section compares the identified car shoppers within the same group.

- This graph will compare New Shoppers, Used Shoppers, and Both Shoppers. New and Used refer to new and used cars.
- You can change the date range for this data as well.
- You can take a closer look at certain metrics by clicking the name of the metric on the graph to cross it off.
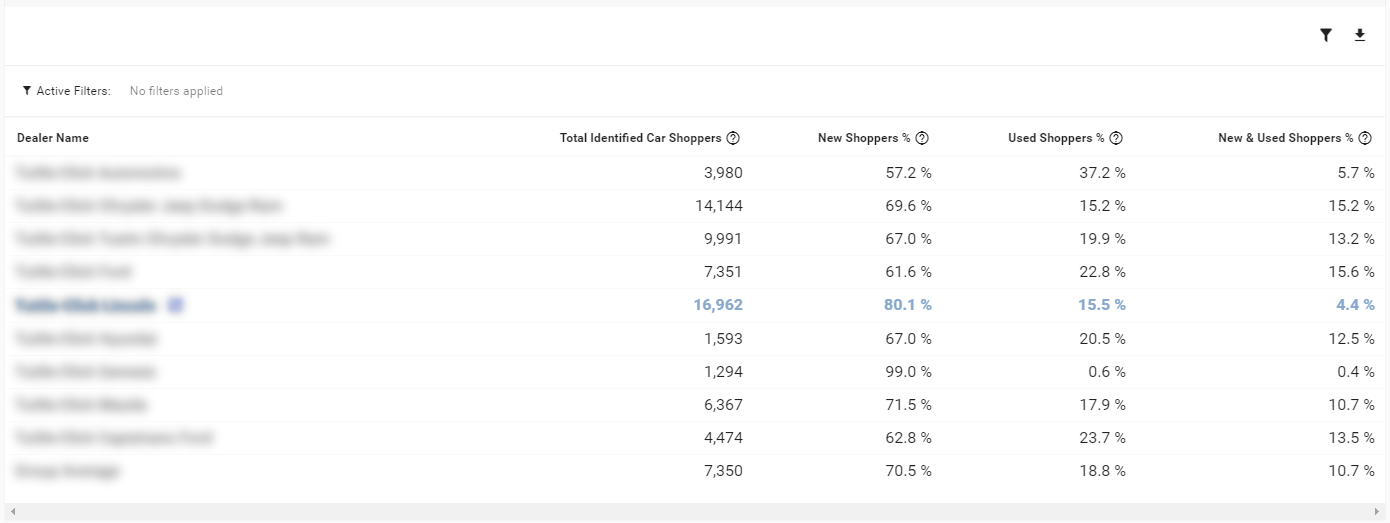
- Below the bar graph, there is a table that displays: Total Identified Car Shoppers, New Shoppers %, Used Shoppers %, and New & Used Shoppers %.
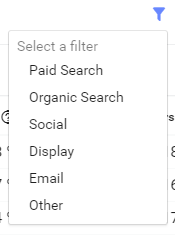
- If you would like to filter out these metrics, you can click on the funnel and select a specific filter. These filters include Paid Search, Organic Search, Social, Display, Email, and Other.
- Clicking any of the metrics on this table will take you to the Shoppers Overview section with more details about your shoppers.
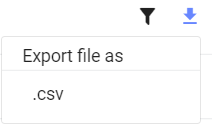
- You can also export the file into a Microsoft Excel file (.csv) by clicking on the button with the down arrow and selecting Export file as .csv.
Last Updated: Feb 19, 2020 2:19 PM
The next section of the Platform is the New Car Shopper Analysis.