The Conversion Analysis section compares the different forms of conversions between the car dealerships in your group.
Conversion Analysis
For the Conversion Analysis section for the Group Comparison tab, it will display the various forms of conversions for your car dealership, while being compared to the other car dealerships in your group.
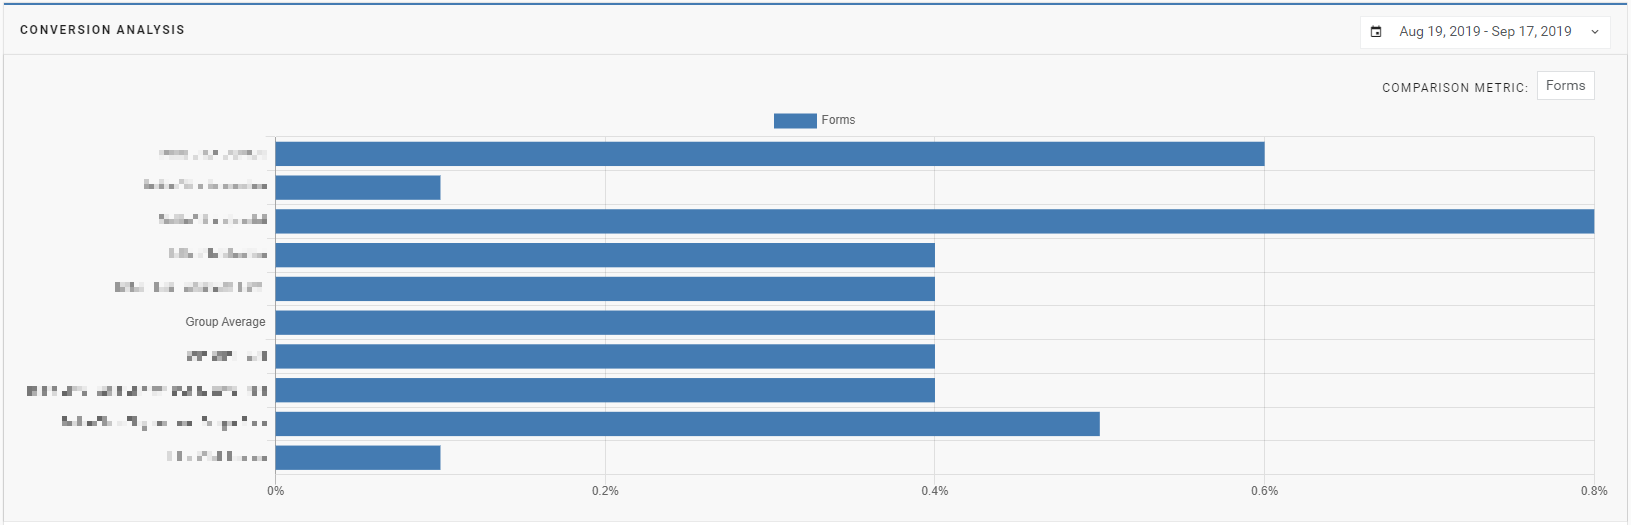
- The default display will show Forms.
- We receive this percentage by comparing when a customer visits your website and fills a form (by entering their information) to the number of total visits
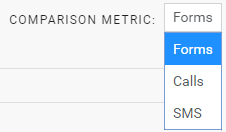
- To change the Comparison Metric, click the drop-down menu on the right side, under the date range and select Calls (phone calls) or SMS (cellular text message) to change the metric.
- Below the bar graph, there is a table displaying all the data for these Comparison Metrics.
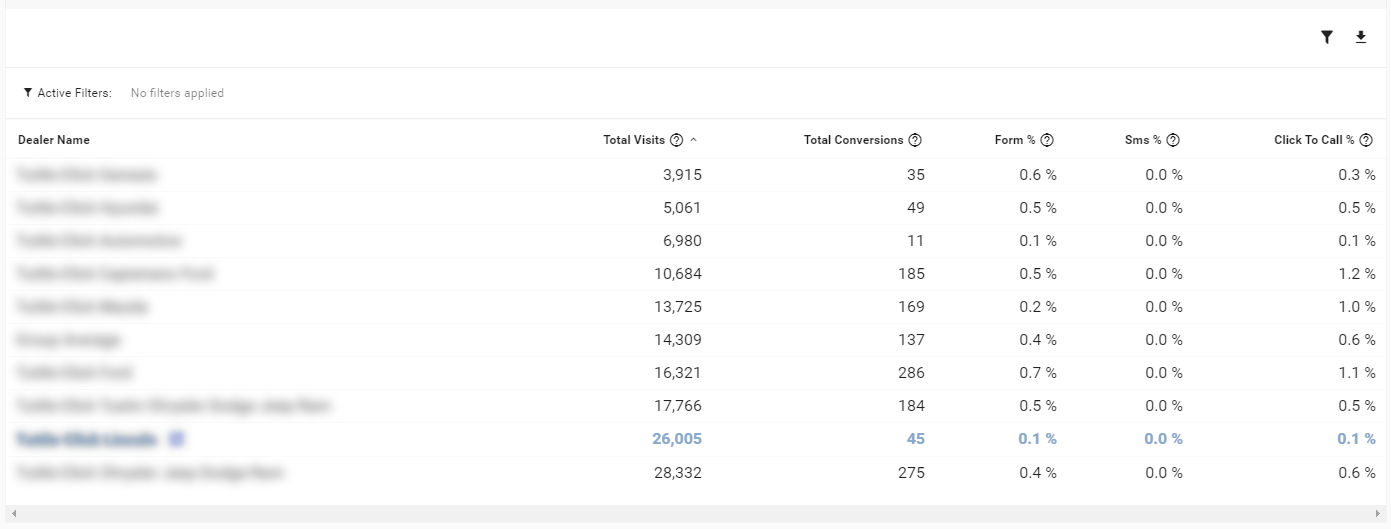
- In the table above, it lists the following:
Total Visits the number of visits your website has received Total Conversions the number of users who filled a form, made a phone call, or sent an SMS message Form % the number of form submissions divided by total visits for forms SMS % the number of SMS messages sent divided by total visits for forms Click to Call % the number of phone calls divided total visits for forms. *Note: The number of form, SMS, and calls are not listed in the above table. - If you click any of the Comparison Metrics in the table, you will be sent to the Conversions tab of the Platform.
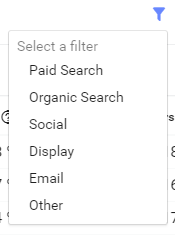
- If you would like to filter out these metrics, you can click on the funnel and select a specific filter. These filters include Paid Search, Organic Search, Social, Display, Email, and Other.
- You can also export the file into a Microsoft Excel file (.csv) by clicking on the button with the down arrow.
Last Updated: June 5, 2020 11:44 AM
The next tab is the Analyze tab.