
Overview: Visits
For the Overview, the default display is a line graph that will show you the comparison Total Visits, Conversions, and Conversion Rates.
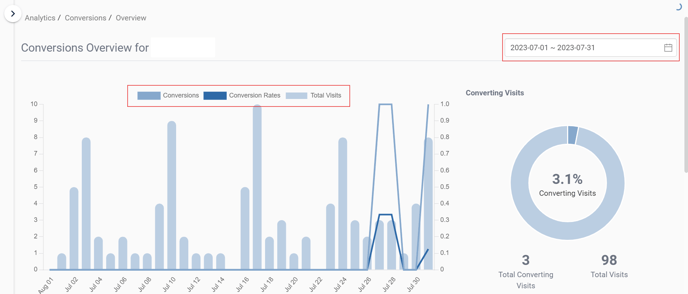
To the right of the line graph, it will show you the percentage of Converting Visits. To get this number, we look at the number of Total Converting Visits to the number of Total Visits.

To view one of the metrics, click the name of the metric(s), and the graph will remove that metric to display the metric you would like to see more clearly (shown in the above graph).
Overview: Actions

You can also change the view of the Overview section by clicking on the Actions tab (shown with the red arrow above).
Actions refer to Converting Actions, which (in this graph) include Click to Call, Click to SMS, and Form Submission.
This tab will show you a pie chart and a line graph that compares all the Converting Actions

Below the graphs, there will be the numerical values of each Converting Action along with the Total Conversion Count.
If you would like to view a different date range, you can also change the date range.
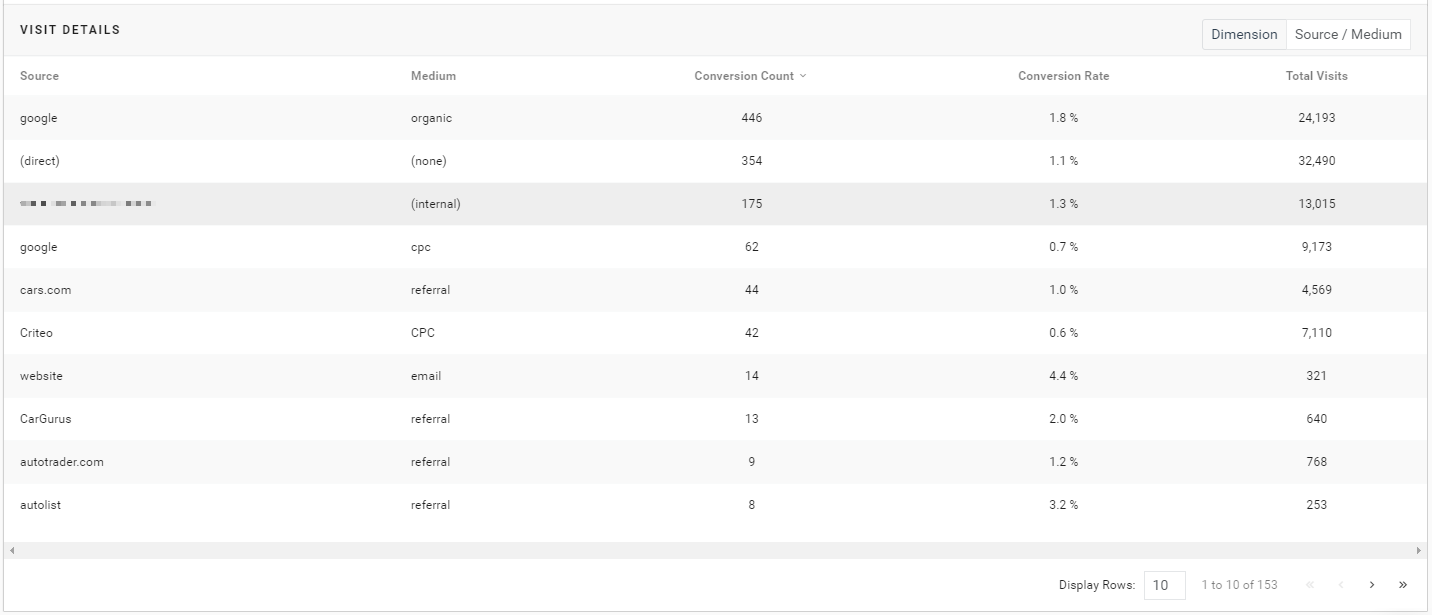
Below the metric list is a table that displays the Visit Details. The default display for the table shows Source, Medium, Conversion Count, Conversion Rate, and Total Visits.
You can change the dimension by selecting the drop-down menu where it states Dimension on the right side of this table.
The options here are Source/Medium, Landing Page, and Campaign.
Landing Page Details

The Landing Page section for Conversions may be important to your car dealership because you can see where your customers are being converted on your website. You can also see which pages have fewer conversions, and work on those landing pages to improve the conversion rates.
Displayed in this section will be the Landing Page, Conversion Count, Conversion Rate, and Total Visits. The landing pages are blue because you are able to click those landing pages and open up that web page.
Campaign Visit Details

This view will show you the different campaigns for your website and the Conversion Count, Conversion Rate, and Total Visits.

To change the number of Rows, click the drop-down menu near Display Rows and select the number of rows you would like to see at a time.
To go forward one page, click the > button; to go back a page, click the < icon.
If you would like to go to the last page, click the >> icon. To go back to the first page, click the << icon.