The Orbee Platform Dashboard
The Orbee Platform Dashboard provides you with a summary report of your dealership's website metrics.
On the Dashboard, we have:
- Website Traffic
- Monthly Funnel
- Top Google/CPC States and Cities
- Device Visits
- Top Classified Source Mediums
- Conversions Overview of Visits and Actions
- You can change the date range on the Dashboard to display different graphs and statistics.
Website Traffic

- On the Dashboard, it will include several metrics based on your car dealership's Website Traffic. This will include:
 On the right side of these metrics, it will include whether your percentages have gone up or down compared to the month before.
- Below the metrics, there will be a Website Traffic graph that will include Total Site Visits, Total Visitor Count, Intent Count, Conversion Count, and Bounce Count.

- This graph is provided for you to compare the metrics within the date range.
- You can also hide individual metrics by clicking on the name.

- In the above map, Total Site Visits and Conversion Count were both crossed off, thus only displaying Total Visitor Count, Intent Count, and Bounce Count.
Monthly Funnel
- The Monthly Funnel consists of graphs that include Total Visits, Intent Visits, and Total Conversions.
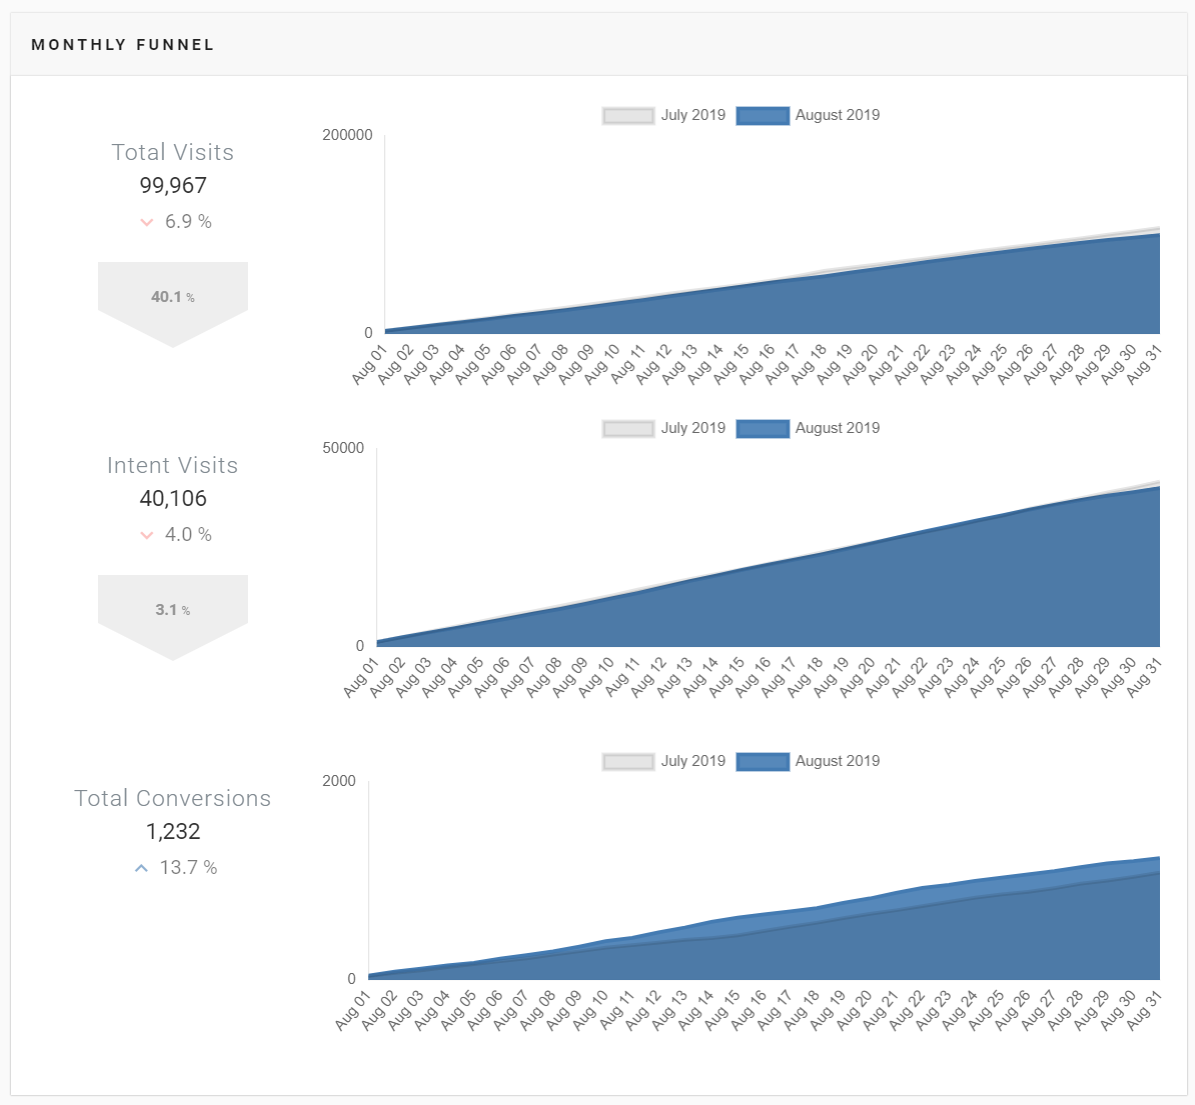
- These graphs will compare two months, typically the last month and the month before.
- This section of your Dashboard will also include whether the numbers have gone up or down for this month.
Top Google / CPC States and Cities
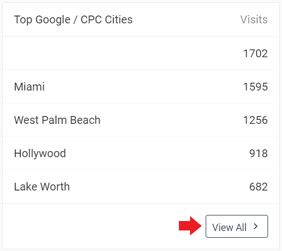
- In these two tables, we can see the top states and cities that click on Google / CPC ads.
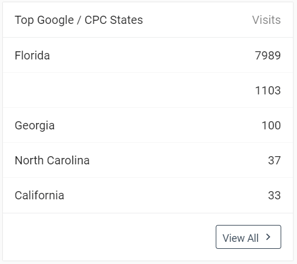
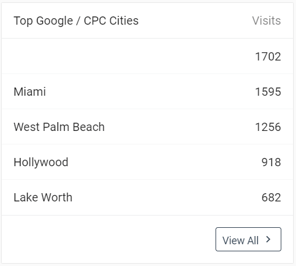
- You can click View All to take a look at the Drilldown Details about these metrics.
Device Visits
- On the Dashboard, it will display a pie chart with the devices used to access your website.
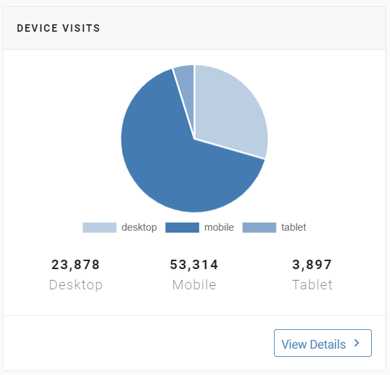
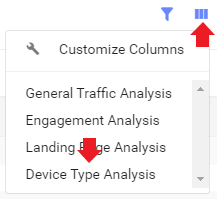
- To look at the Drilldown Details of the Device Visits, click View Details and select the three bars on the right side of the screen, just below the line graph.
- Then, select Device Type Analysis to take a closer look at which devices were used to view your website.
Top Classified Source Mediums
- This table will show the top classified source/mediums along with the Intent Rate, Conversion Rate, True Bounce Rate, and Total Visits.
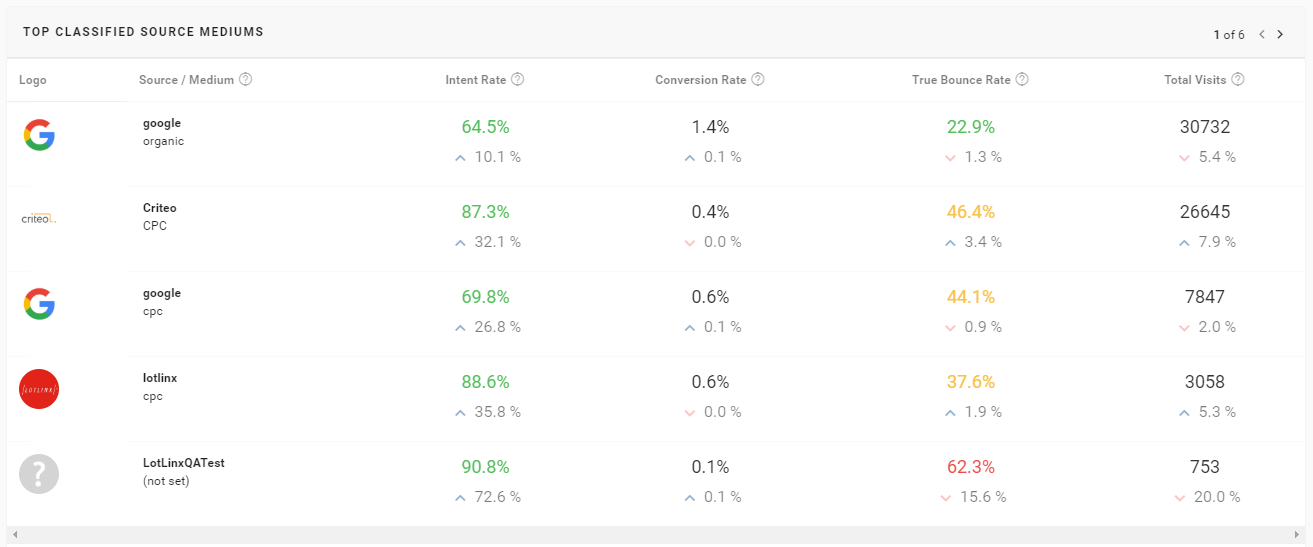
- We will go over this section more in-depth in the article, Analyze: Source Medium.
- If you click View All, it will take you to the Source Medium section of the Platform.
Conversions Overview of Visits and Actions
- In this last section of the Dashboard, you will see the Conversions Overview of Visits and Actions.
- Under the Visits tab, there is a line graph that will display Total Visits, Conversions, and Conversion Rates.
- It will show the percentage of those visitors that are considered a conversion (Converting Visits). It will also display how many Total Converting Visits are compared to the number of Total Visits.
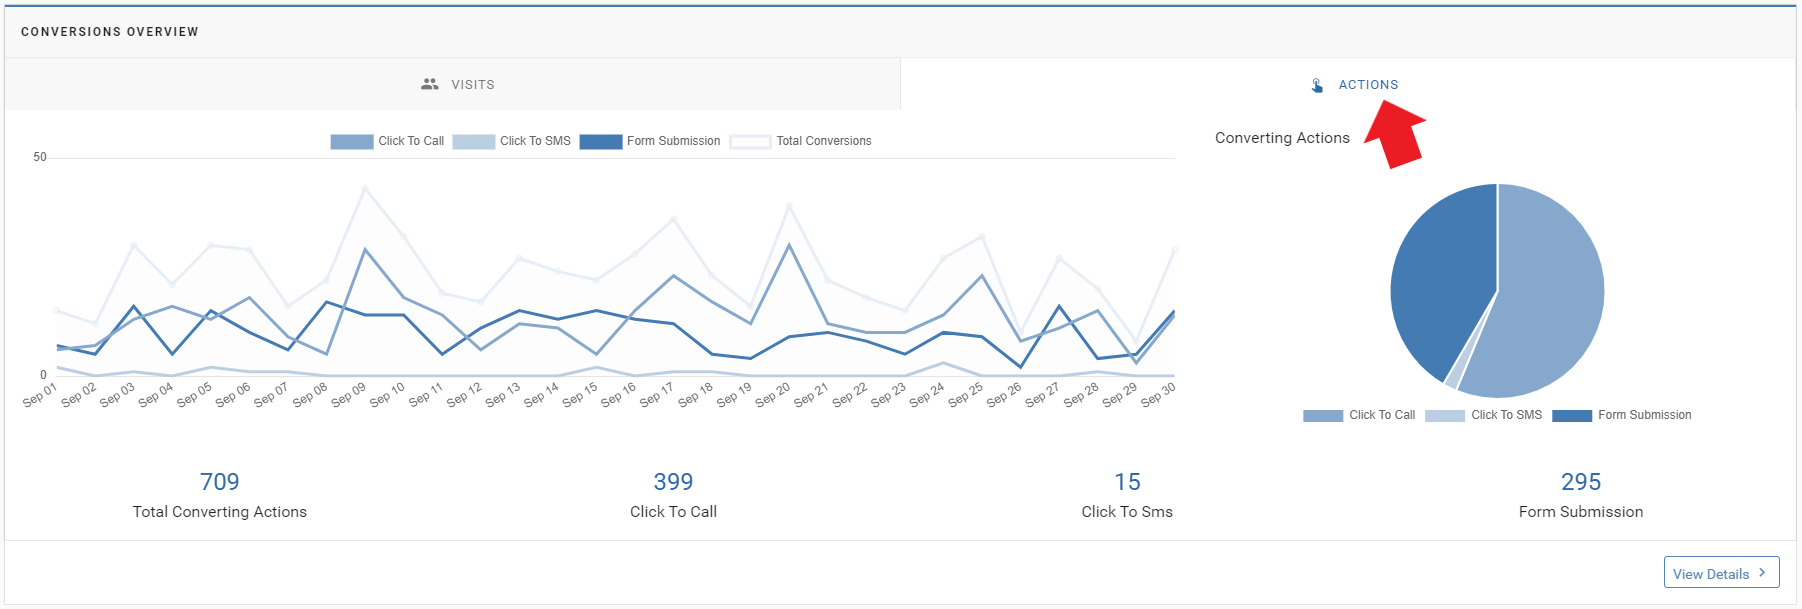
- If you click the Actions tab, you can see a line graph and pie chart that shows the number of Total Conversion Count, Click To Call, Click To SMS, and Form Submissions.
- The Actions tab refers to any converting actions that visitors make on your website during the time. This includes: Click To Call, Click to SMS, and Form Submission.
- Some dealerships may not have the Click to SMS metric because your website does not offer this option for shoppers.
- Clicking View Details on the bottom right of the graph will lead you to the Conversions tab of the Platform.
Note: You can also hide a metric (similar to the graphs above) if you would like to see specific metrics on the chart.

