Engagement Analysis
Under the Group Comparison tab, we also have the Engagement Analysis section.
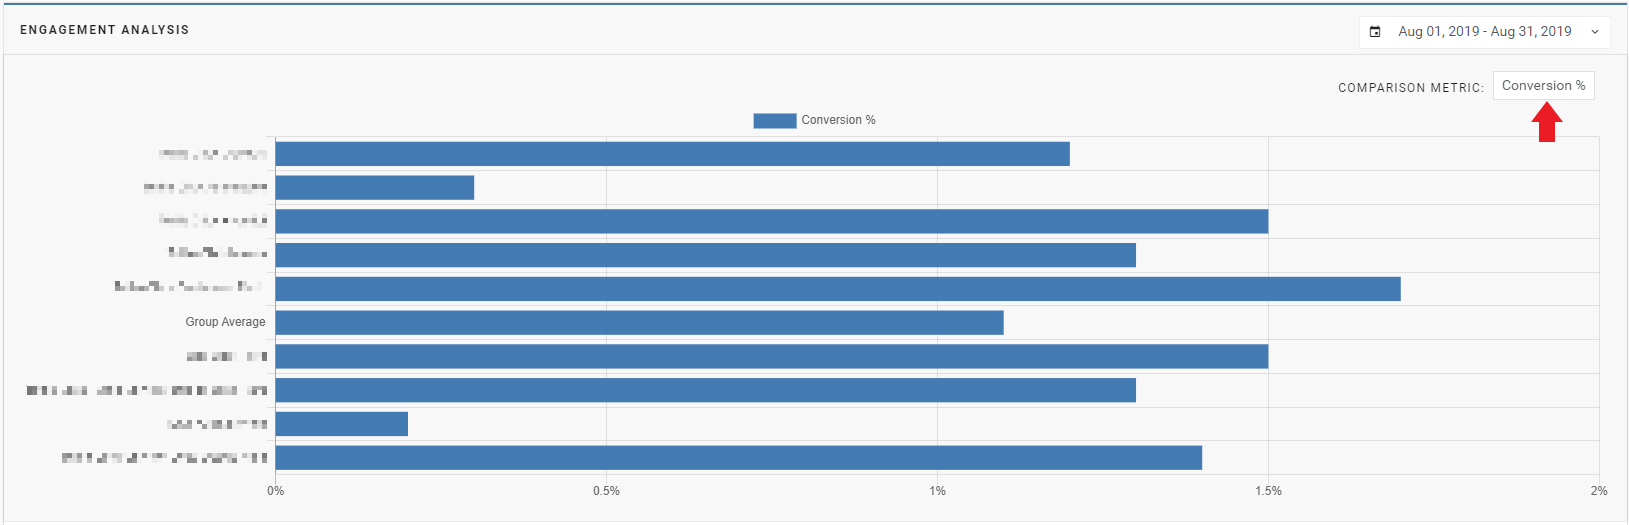
- For the Engagement Analysis, the default display will be Conversion %.
- You will be comparing all the car dealerships in your groups and the percentage of customers that have completed a converting action.
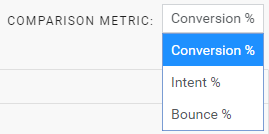
- To change the Comparison Metric, click the drop-down menu at the top right under the date range. Select Intent % or Bounce %.
- Below the bar graph, there is a table that displays a table of all the data for the Engagement Analysis.
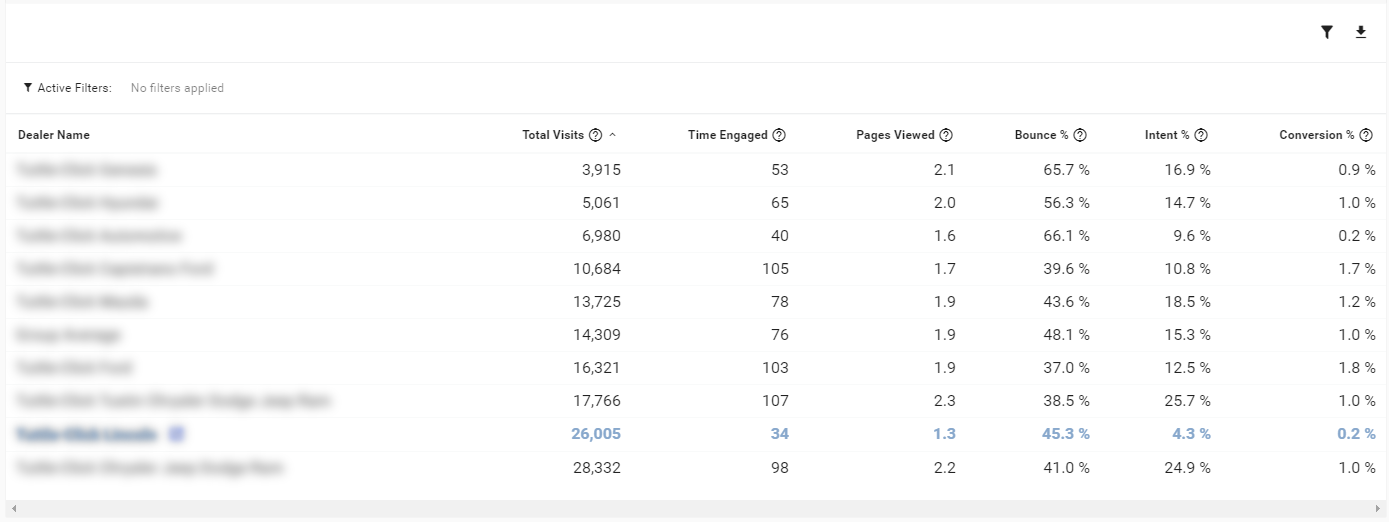
*Note: The blue, bold text indicates the current dealership you are looking at.
- Clicking any of these metrics will take you to the Drilldown section of the Platform with more in-depth information about your customers' engagement.
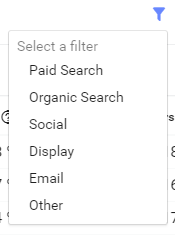
- If you would like to filter out these metrics, you can click on the funnel and select a specific filter. These filters include Paid Search, Organic Search, Social, Display, Email, and Other.
- You can also export the file into a Microsoft Excel file (.csv) by clicking on the button with the down arrow.
Last Updated: June 5, 2020 11:17 AM
The next section of the Platform is the Conversion Analysis.