General Shopper Analysis
General Shopper Analysis takes a look at the metrics of your customers as compared to the other dealership websites in your group. You can change the date range if needed.

- In the example above, there are nine car dealership websites.
- This bar graph is displaying the number of return shoppers to the number of non-return shoppers.
- This graph also includes the group website and the Group Average.
- The Group Average will consist of the entire group's average.
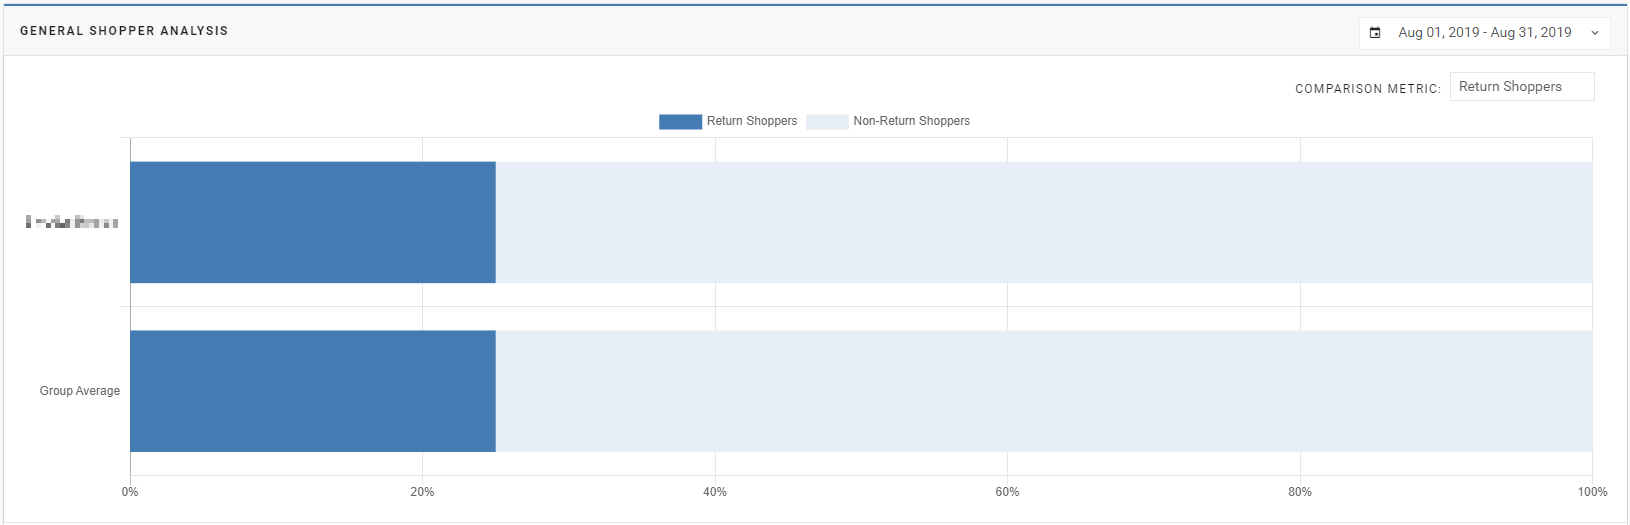
*Note: If your car dealership does not belong to a group, the Group Average will remain the same (because there is no number to average with).
- If you would like to change the Comparison Metric, you can select a different metric using the drop-down menu below the date range.
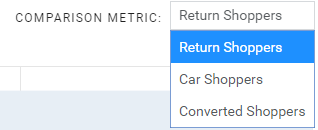
- Changing the metric to Car Shoppers will display a graph that will compare the percentage of Car Shoppers vs. Non Car Shoppers
- Converted Shoppers will display Converted Shoppers vs. Non Converted Shoppers
- Just below the bar graph, there will be a table that lists the metrics for each dealership. The metrics will include:
- Total Shoppers
- Return Total Shoppers %
- Engaged Car Total Shoppers %
- Converted Total Shoppers %
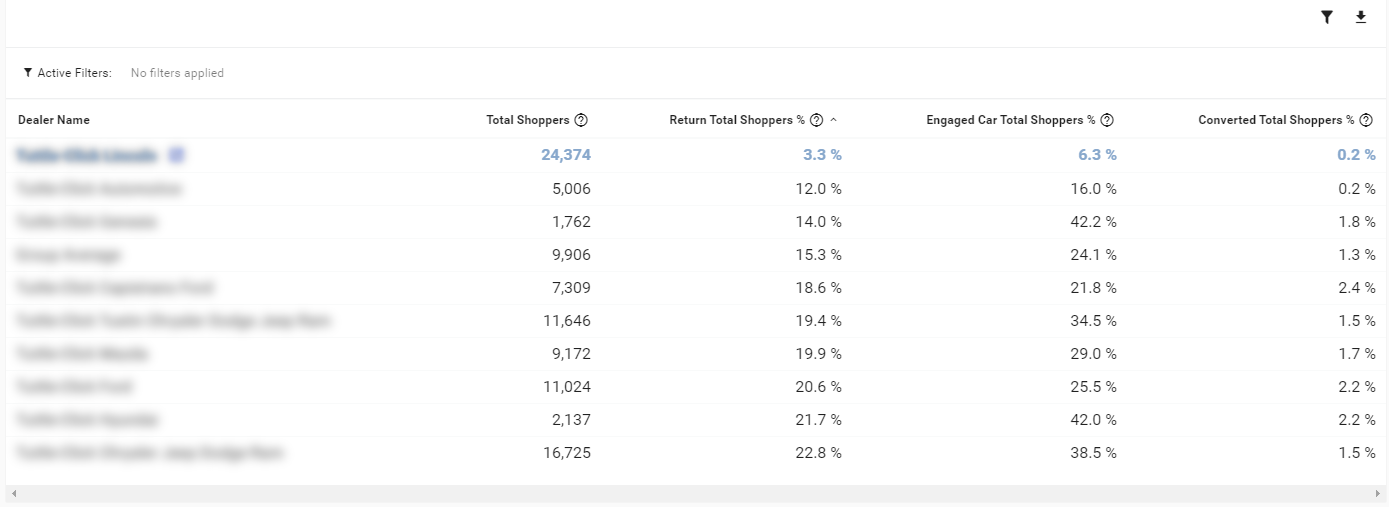
- Clicking any of these metrics will take you to the Shoppers Overview section of the Platform.
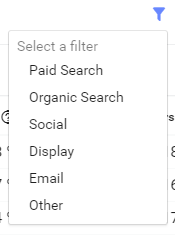
- If you would like to filter out these metrics, you can click on the funnel and select a specific filter. These filters include Paid Search, Organic Search, Social, Display, Email, and Other.
- You can also export the file into a Microsoft Excel file (.csv) by clicking on the button with the down arrow.
Last Updated: June 5, 2020 10:56 AM
To learn more about the Group Comparison tab, check out Sales vs. Shopper Analysis!