
For some metrics, a higher percentage can be positive, whereas others can be negative.
- For True Bounce Rate the lower the percentage, the more positive the impact is of your marketing efforts.
- For Intent Rate and for Conversion Rate, you would want those percentages to be higher.
Knowing this, we can distinguish the different colors for the metric rates.
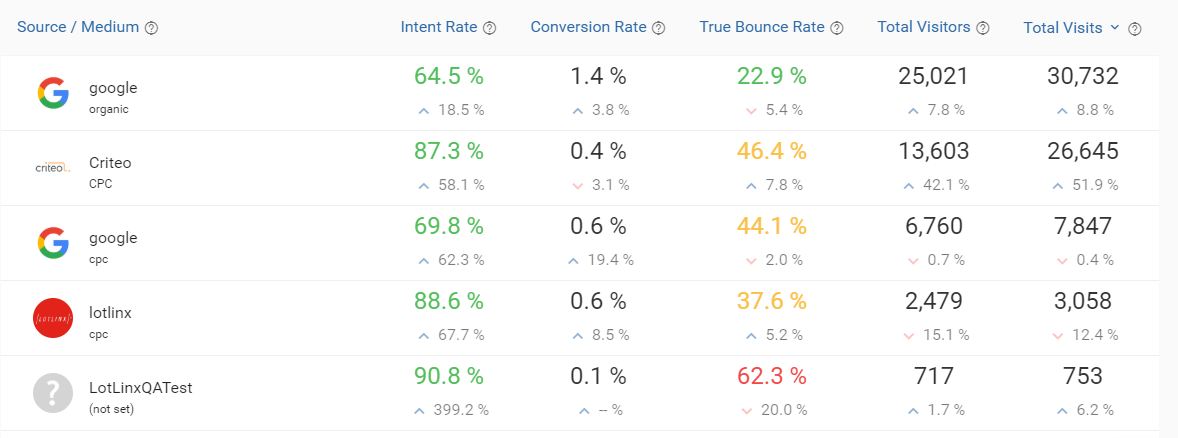
Below, we have a list of how Orbee determines the color ranges for each metric:
- Intent Rate
- 0-5% is Red
- 5-10% is Yellow
- More than 10% is Green
- True Bounce Rate
- 0-30% is Green
- 30-50% is Yellow
- More 50% is Red
- For Conversion Rate, we do not display it with color because the rates were too small to find a good range breakdown.
- When you are looking at these colors, please realize that not all metric rates in red are a negative result of your marketing efforts.
- There are several reasons as to why your rates may be marked as red. It could be a specific campaign type or that your website is not optimized for the best user experience.
Last Updated: Dec 9, 2019 4:25 PM
If you have any other questions, feel free to search the Knowledge Base or contact an Orbee representative.