Analytics: Monthly Cost Performance
The Monthly Cost Performance tool allows dealerships to calculate cost metrics for each Source/Medium by analyzing monthly spending, cost per visit, and conversion rates, with features to adjust budgets and view detailed visitor analysis.
Monthly Cost Performance Overview
The Monthly Cost Performance which includes the Visit Funnel and Visitor Analysis sections allows your dealership to calculate the cost metrics for each Source/Medium based on the monthly cost or spend. To navigate to this section, go to the Orbee Platform and follow this path: Analytics > Analyze > Monthly Cost.
Visit Funnel
Above these dashboards, you can adjust the date by selecting the month and/or year from the drop-down menu. Additionally, you can search for a specific source using the search bar at the top right, just below the date selectors.

The Visit Funnel table includes:
- Monthly Cost: The total amount your dealership spends on this source/medium each month.
- Cost per Visit: The average cost per visit for this specific source/medium.
- Visits Count: The number of visits from this source/medium displayed below the budget.
- Cost per Returning Visitor: The average cost per returning visitor (including those who have visited before) relative to the monthly cost.
- Returning Visitors Count: The number of returning visitors from this source/medium displayed below the cost.
- Cost per Conversion: The average amount your dealership pays per conversion for this specific source/medium.
- Conversions Count: The number of conversions from this source/medium displayed below the cost.
The budget listed for your source/mediums carries over to the next month. This setup is designed for your dealership in case your budgets remain consistent each month.
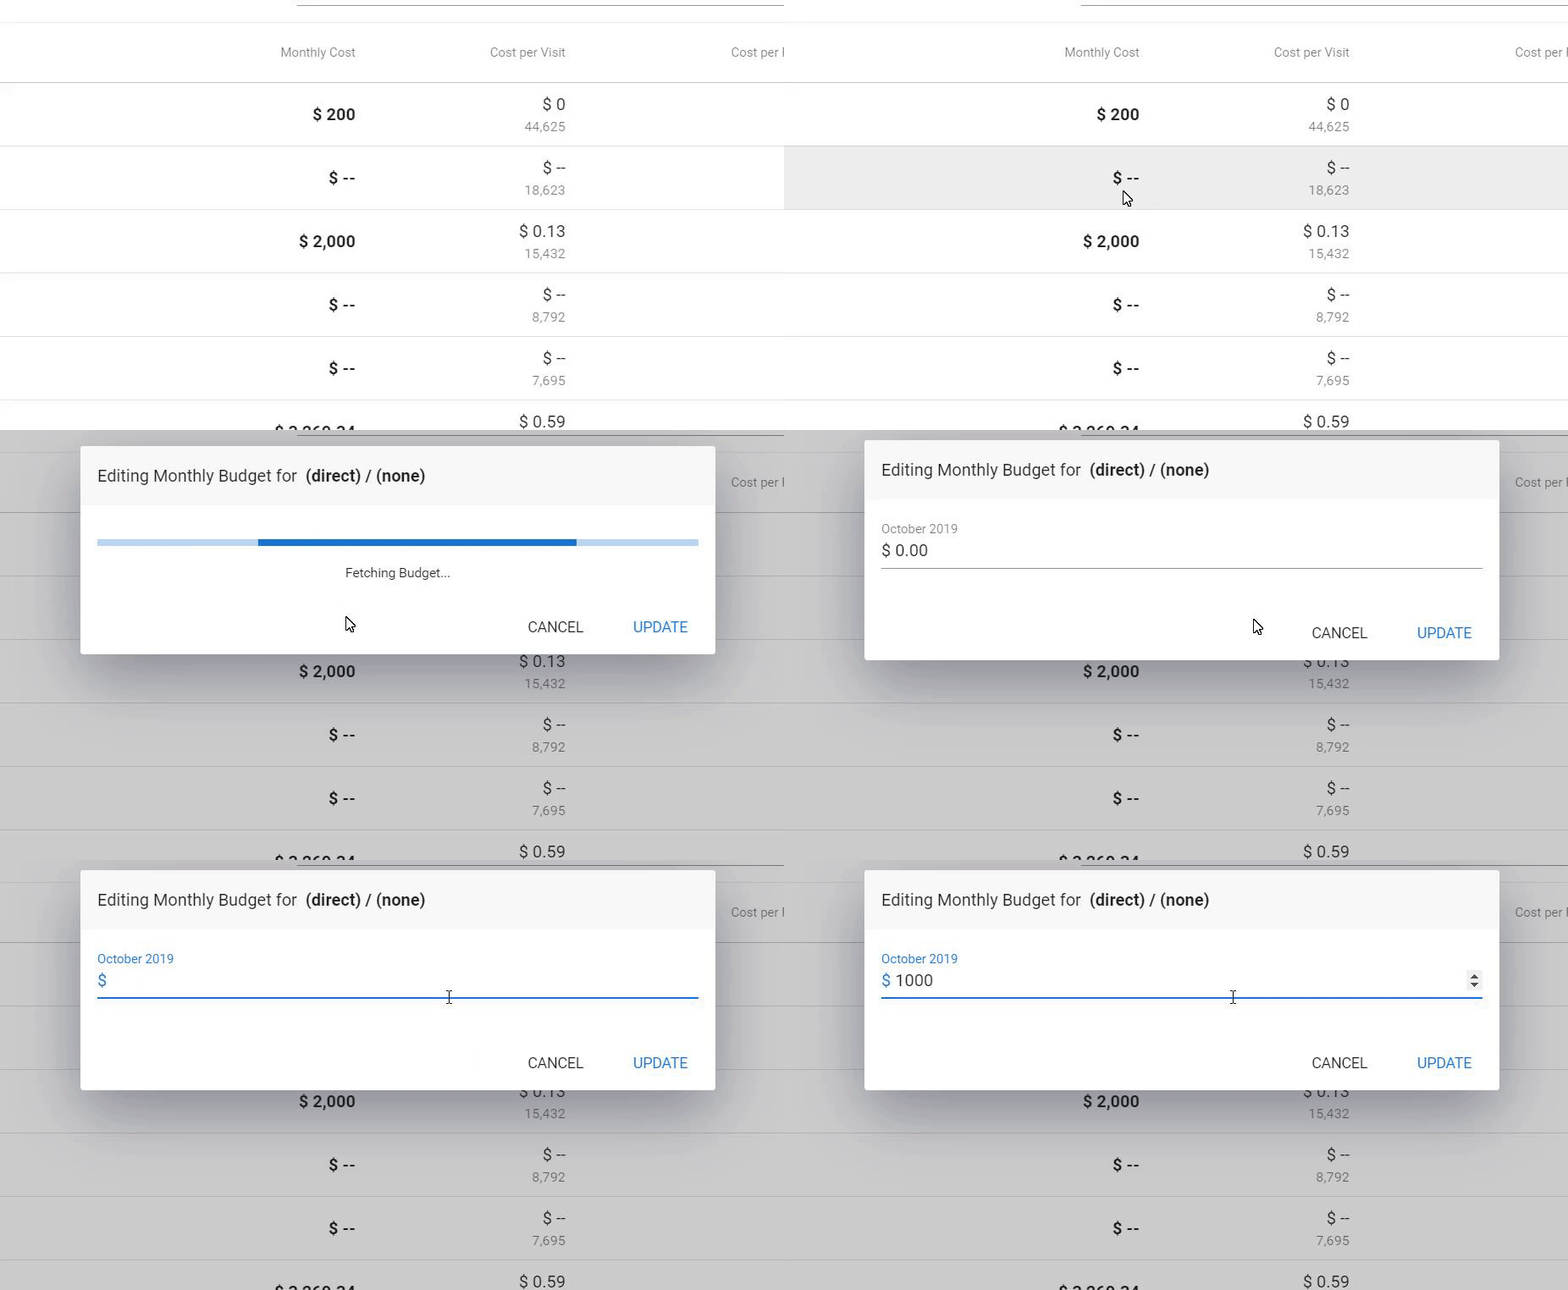
To adjust the budget for a specific month and year, click on the Monthly Cost, enter the desired amount, and then click Update. This action will apply the new budget to the table and recalculate the metrics accordingly.

Visitor Analysis
The Visitor Analysis table provides details on Monthly Cost, Cost per Visitor, and visitor counts for each source/medium. It also allows you to adjust the Monthly Cost and customize how many rows are shown per page, with options to navigate between pages.

The Visitor Analysis table includes:
- Source/Medium: The specific source or medium being analyzed.
- Monthly Cost: The total amount spent on this source/medium per month.
Cost per Visitor: The average cost per visitor for this source/medium. The number below this cost represents the total number of visitors. - Cost per New Visitor: The average cost per new visitor for this source/medium. The number below this cost represents the total number of new visitors.
- Cost per Returning Visitor: The average cost per returning visitor for this source/medium. The number below this cost represents the total number of returning visitors.
- Adjust Monthly Cost: You can also modify the Monthly Cost for the Source/Medium within this section.
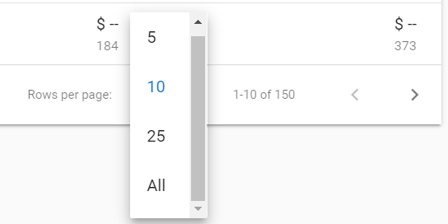
To change the number of rows displayed per page, scroll down to the bottom and use the drop-down menu to select 5, 10, 25, or all rows. Navigate between pages using the > arrow to go forward and the < arrow to go back.

For more information, you can read about the difference between visitors and visits.
