
This report includes various dashboards to track the effectiveness of campaigns in driving engagement, conversions, and customer re-engagement. Dealerships can use this report to fine-tune their email marketing strategy, optimize campaigns, and improve ROI by analyzing key metrics across multiple performance indicators.
‼️Because of the size of the data being pulled, there can be delays in load times for the report. Multiple refresh attempts may be necessary in these cases.
View the Report
- Sign in to Orbee
- From the top menu, select Analytics
- On the left, scroll down to Dashboards and select Email Campaign Performance
Where the data comes from
The Email Campaign Performance Report is sourced from Orbee First Party data or website data. This is the data that is collected via the Orbee script that is injected onto your website and within (vendor-approved) digital retailing tools and iframes.
‼️It’s important to ensure that all expected traffic sources are tagged properly for accurate reporting. Most sources will have auto-tagging features available, but it’s good practice to check with your partners to ensure proper tagging even in manual tagging cases. Orbee generated emails are tagged as:
Adhoc/Single Sends: orbee/email
Automated Sends: website/email
Campaign by Source - Performance Summary

This table displays key metrics (visits, conversions, conversion rate, bounce rate, vehicle views, newly identified shoppers, reactivated shoppers) by source medium, helping dealerships evaluate which channels are most effective in driving engagement and conversions, guiding future marketing strategies and resource allocation.
Visitor Device Breakdown
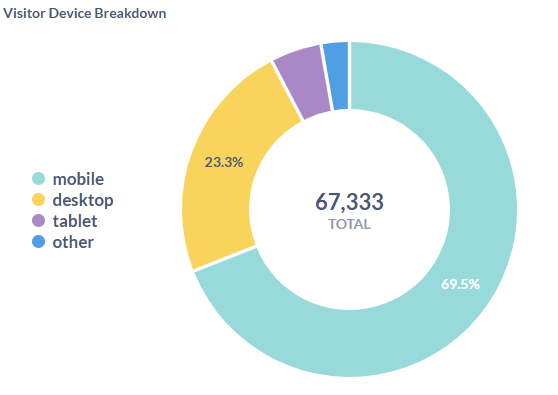
This donut chart shows the types of devices (mobile, desktop, etc.) used by visitors who viewed the email, helping dealerships understand device preferences to optimize email design and improve user experience across platforms.
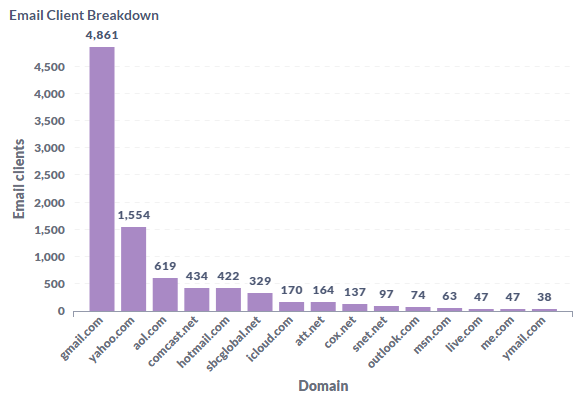
Email Client Breakdown
The bar chart shows the number of users by email client (e.g., Gmail, Outlook), allowing dealerships to optimize email formatting and delivery for the most popular clients, enhancing email readability and engagement.
Conversion Action Type
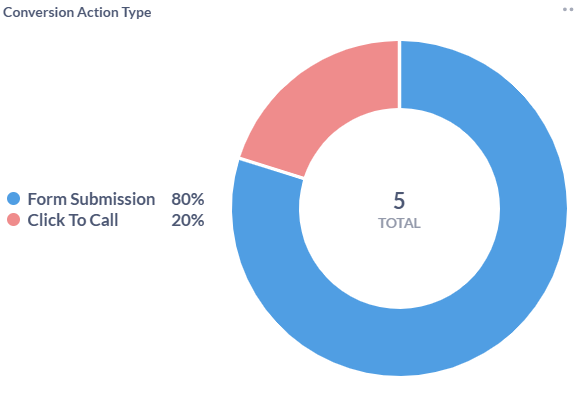
This donut chart reveals the type of conversion (form submission or click-to-call) that occurred through an Orbee email, helping dealerships understand how customers prefer to engage and tailoring follow-up actions based on these insights.
Where your email visits landed on
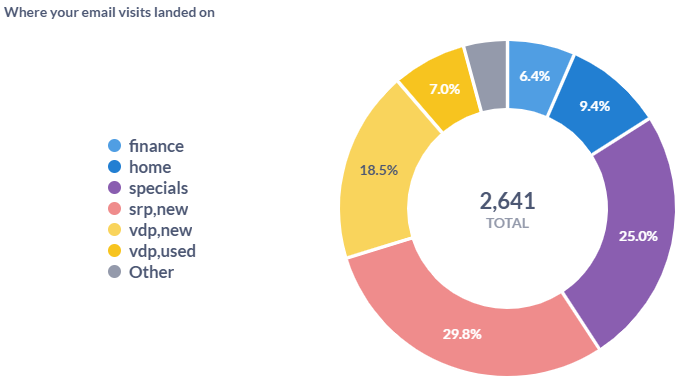
This donut chart shows the landing pages that shoppers visited after clicking on the email, enabling dealerships to see how effective their landing pages are at engaging users and leading them toward a conversion.
Where your email visits converted
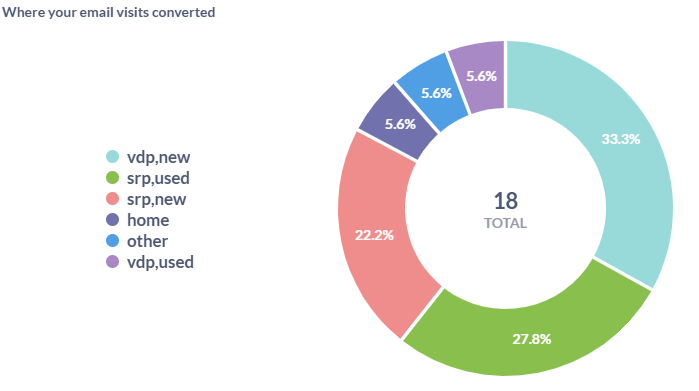
In consideration to the previous chart, this chart can be compared to show which landing pages generated conversions, helping dealerships identify the most effective pages and optimize them for higher conversion rates.
i.e., while most users landed on the finance page - most conversions occurred on a vdp, new page.
Top 5 Converting Email Campaigns
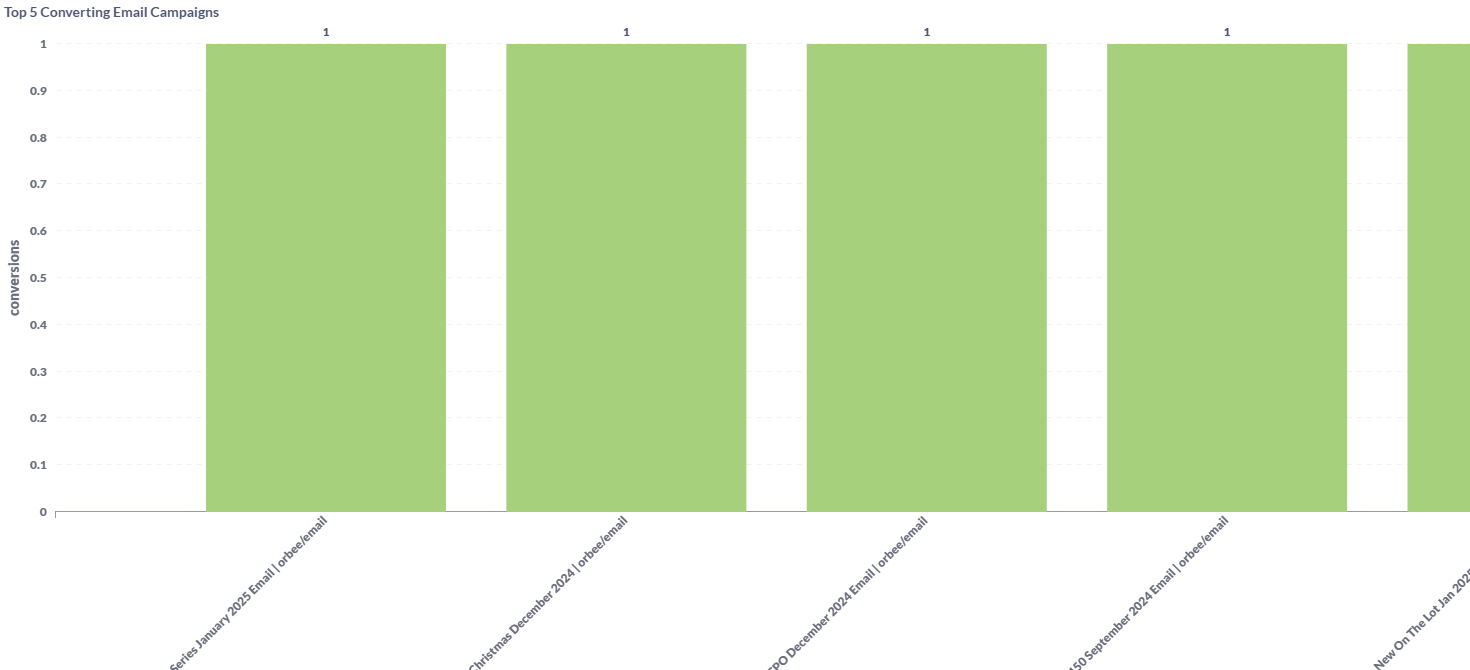
The bar graph highlights the top five email campaigns by conversion counts, providing insights into which campaigns are most successful and informing future campaign designs.
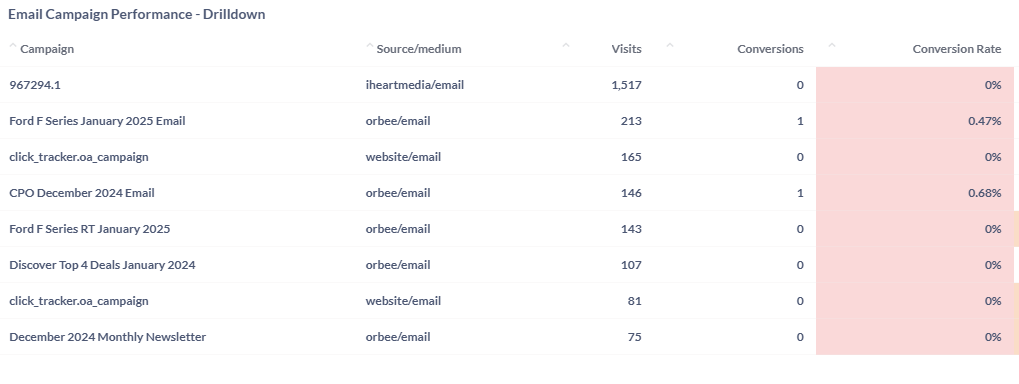
Email Campaign Performance - Drilldown
Customer Engagement by Campaign
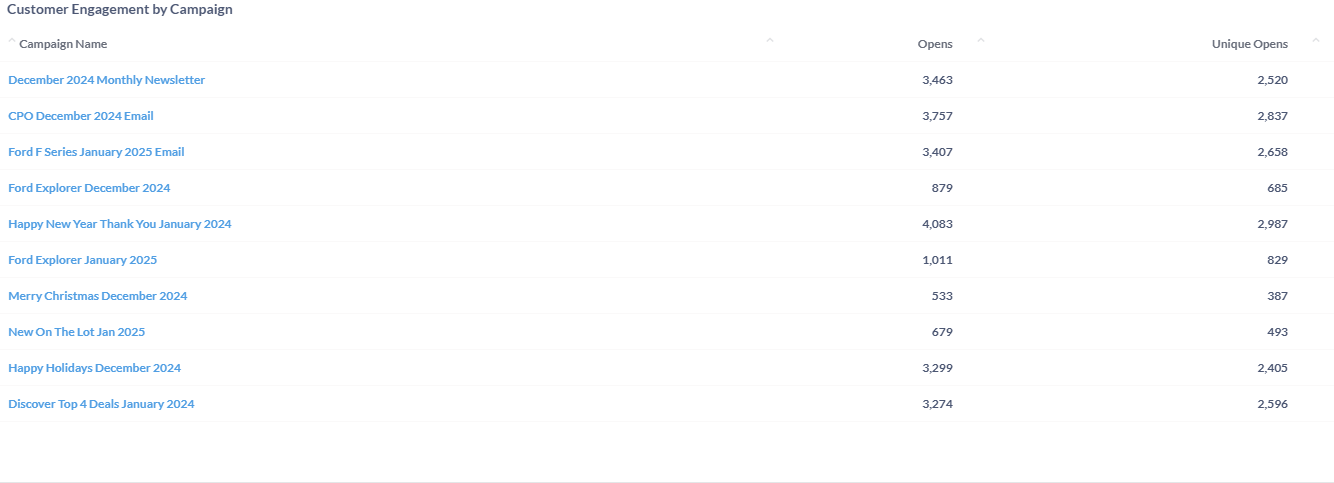
This dashboard displays metrics like opens, unique opens, clicks, and unique clicks by campaign name, helping dealerships assess overall engagement levels and determine which campaigns have the highest user interaction.