
** The Leads Overview Report replaced the former report: Leads by Converting Source Medium
‼️Because of the size of the data being pulled, there can be delays in load times for the report. Multiple refresh attempts may be necessary in these cases.
View the Report
- Sign in to Orbee
- From the top menu, select Analytics
- On the left, scroll down to Dashboards and select Leads Overview
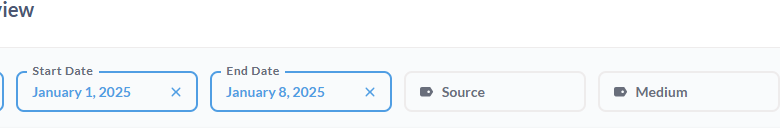
The report allows filtering by date range, source and medium.
Where the data comes from
The Leads Overview report is sourced from Orbee First Party data or website data. This is the data that is collected via the Orbee script that is injected onto your website and within (vendor-approved) digital retailing tools and iframes.
‼️It’s important to ensure that all expected traffic sources are tagged properly for accurate reporting. Most sources will have auto-tagging features available, but it’s good practice to check with your partners to ensure proper tagging even in manual tagging cases.
Leads Overview Summary
The summary dashboard provides callouts of significant metrics related to conversion traffic.
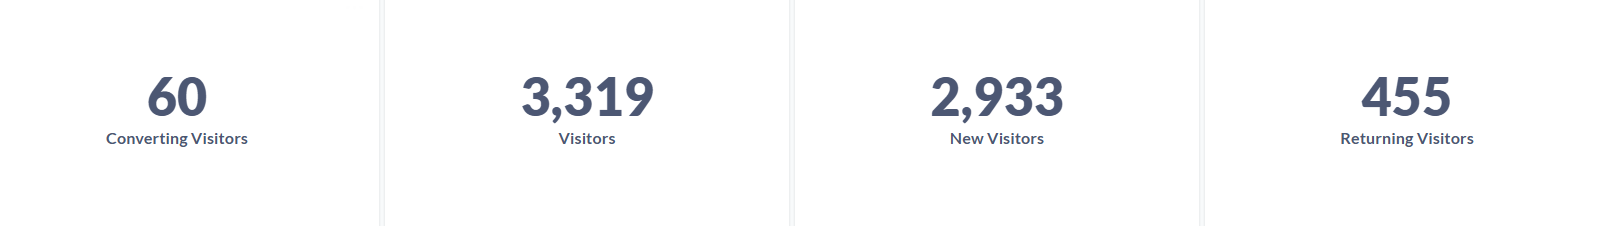
- Converting Visitors: Indicates successful engagement and lead generation; a benchmark for the automotive industry is a 2-3% conversion rate.
- Visitors: Tracks total website traffic for monitoring marketing reach; a benchmark for mid-sized dealerships is 10,000+ monthly visitors.
- New Visitors: Measures first-time engagement effectiveness; benchmarks show 60-70% of total visitors should be new.
- Returning Visitors: Reflects interest and sustained engagement; 30-40% returning visitor rate is expected.
Visitor Daily Trends
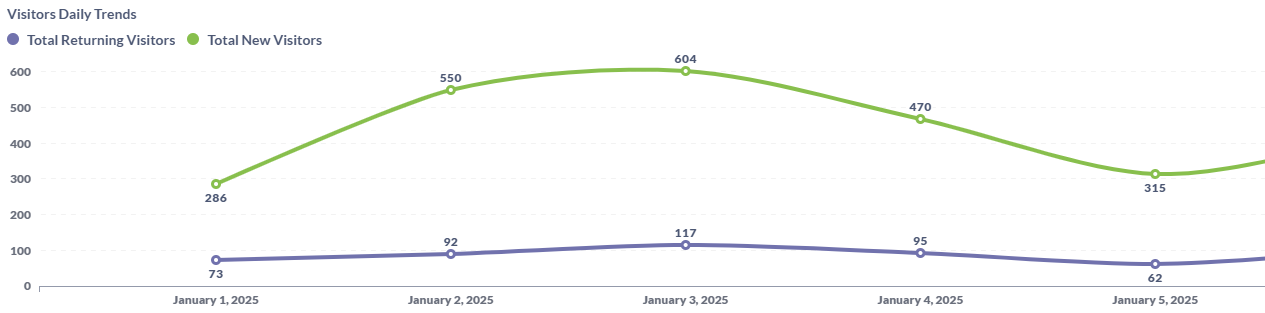
Displays daily trends of new and returning visitors to understand traffic patterns and the impact of marketing campaigns.
Where did your visitors who performed a conversion come from?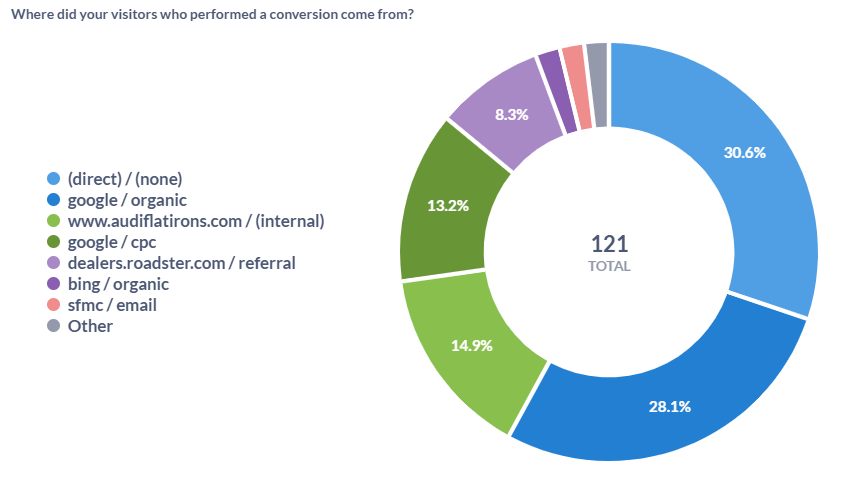
Identifies which channels drive conversions, helping to refine marketing spend and target effective sources.
How long were visitors engaged and did they convert?
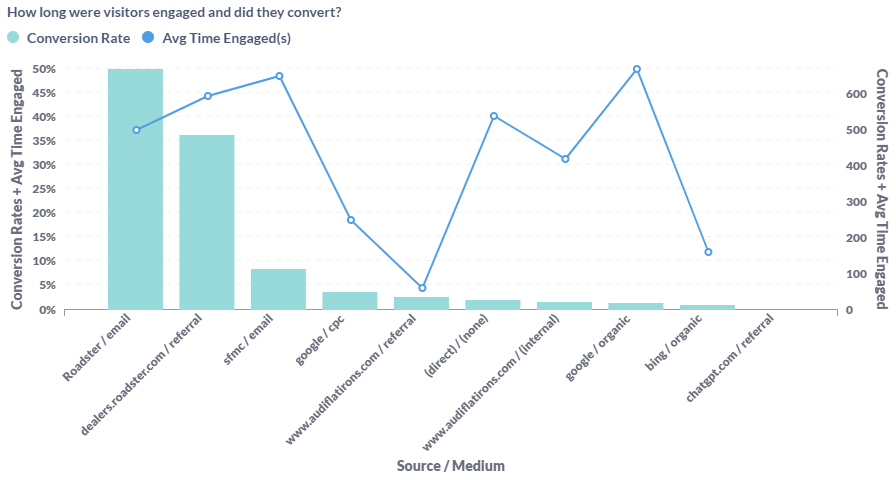
Evaluates how engagement duration by source impacts conversions, providing actionable insights into traffic quality.
How engaged were your visitors based on their landing page tag?
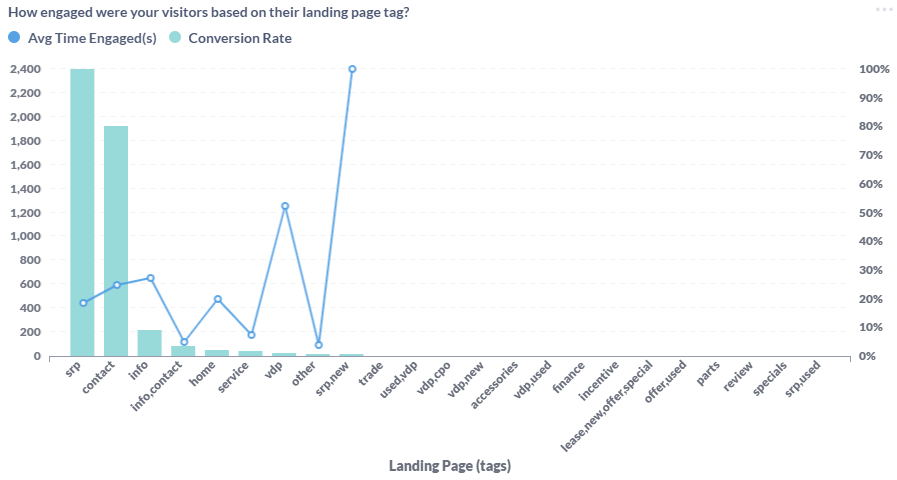
Highlights which landing pages convert best and how long shoppers engage, optimizing landing page performance.
What kind of conversion event did your visitors perform?
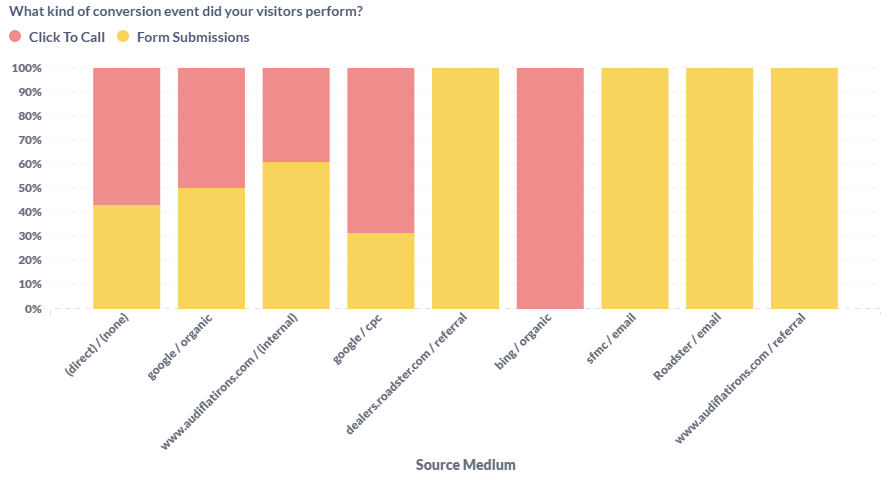
Shows the distribution of conversion types (e.g., calls vs. form submissions) by source to guide event-specific optimizations.
What page did your leads convert on?
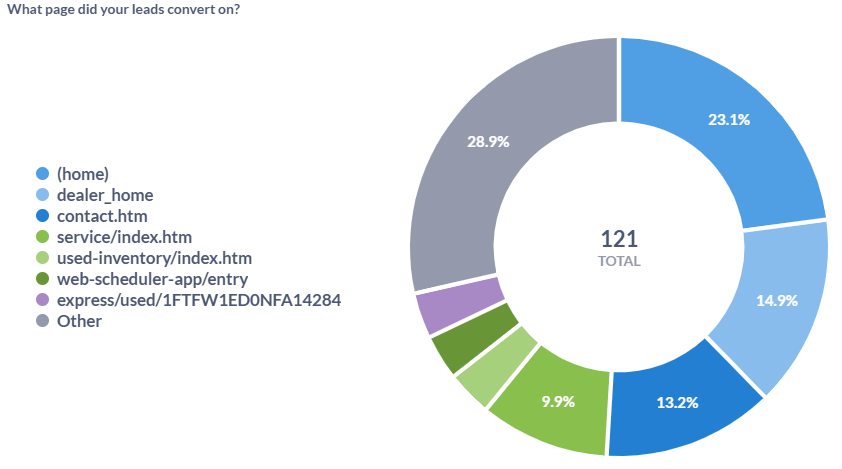
Reveals which pages drive conversions, aiding in prioritizing high-impact content.
What car condition are your visitors shopping for?

Displays the distribution of conversions by vehicle condition to align inventory with demand.
What channels did your visitors convert the most from?
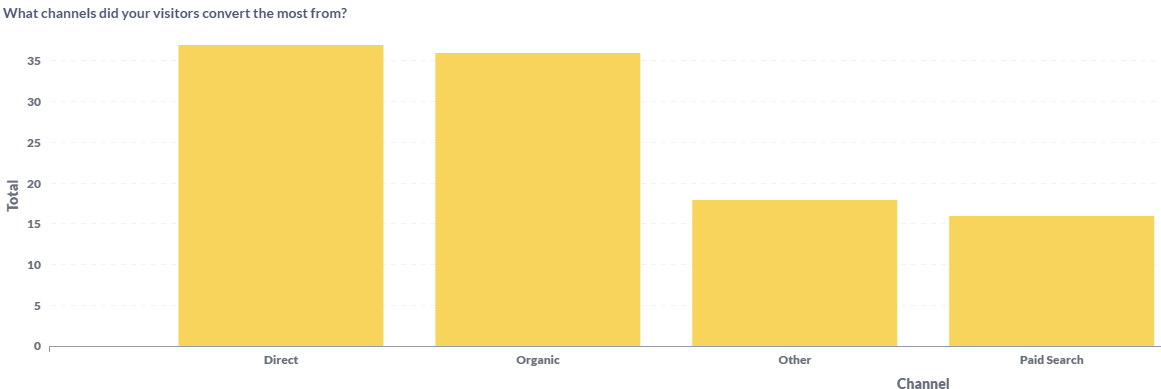
Visualizes which sources generate the most conversions, supporting better budget allocation.
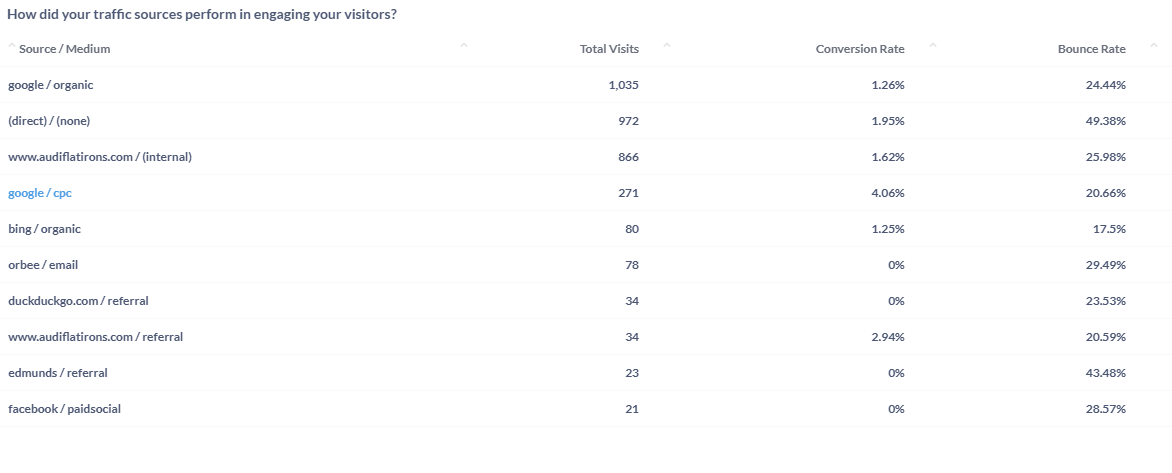
How did your traffic sources perform in engaging your visitors?
Provides detailed metrics (e.g., bounce rate, conversion rate, intent rate) to evaluate and optimize source-specific strategies.
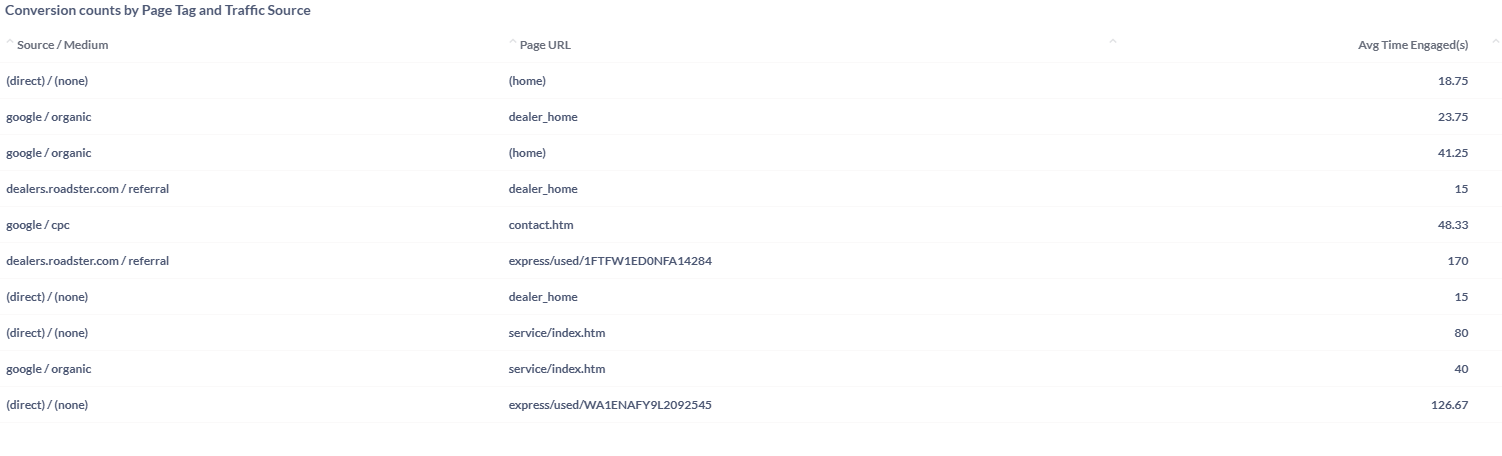
Conversion counts by Page Tag and Traffic Source
Links traffic sources to landing pages, showing engagement time and conversion counts for targeted improvements.
Converting Shoppers with Vehicle of Interest and Contact Info
Lists converting leads and their details, enabling follow-ups and actionable dealership outreach; exportable for sales use.