
This report loads based on the last full calendar month and includes touchpoints that can be customized for attribution, allowing dealerships to gain deeper insights into the performance of various marketing channels.
Available for integrations with Vin Solutions, Dealer Socket, Drivecentric, and Dealervault, this report enables dealerships to analyze and optimize their lead attribution and sales strategies.
The report's detailed breakdown of lead sources and shopper behavior helps dealerships make more informed decisions about where to focus their efforts for maximum impact.
View the Report
- Sign in to Orbee
- From the top menu, select Analytics
- On the left, scroll down to Dashboards and select Sold Matchback Attribution Report
‼️Because of the size of the data being pulled, there can be delays in load times for the report. Multiple refresh attempts may be necessary in these cases.
Where the data comes from
The Sold Matchback Attribution Report is sourced from Orbee First Party data or website data and CRM/DMS data. This is the data that is collected via the Orbee script that is injected onto your website and within (vendor-approved) digital retailing tools and iframes. The CRM/DMS data is collected through the vendor-approved integration.
It’s important to ensure that all expected traffic sources are tagged properly for accurate reporting. Most sources will have auto-tagging features available, but it’s good practice to check with your partners to ensure proper tagging even in manual tagging cases.
If you expect any changes with your CRM/DMS it’s important to inform Orbee Support in order to prepare for any updates to your integrations. This can help avoid any gaps in data.
Sold Data Summary
The first set of cards provides a high level view of your sold shopper journey data.
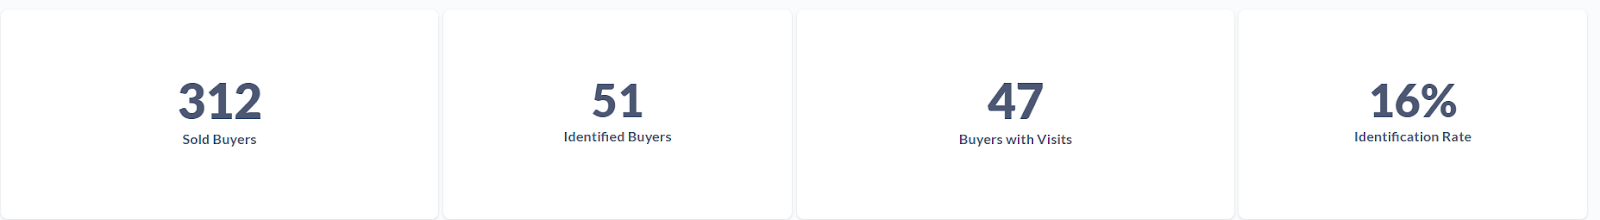
- Sold Buyers: the total number of buyers reported by the CRM. It helps dealerships track actual sales but may have slight variances if the sale is not linked to a resolved email address or phone number.
- Identified Buyers: sold buyers that have been matched with Orbee data. A difference between sold and identified buyers can occur when shoppers do not engage with the website or Orbee email campaigns, or if they are walk-ins without identified information. This helps dealerships understand how many buyers can be tracked through their digital journey for better attribution.
- Buyers with Visits: the subset of identified buyers who visited the website. This distinction is important for dealerships to see how many of their buyers are engaging with the website, as some buyers may be identified through third-party leads but never actually visit the site.
- Identification Rate: This ratio compares identified buyers to total sold buyers and serves as a benchmark metric, with a typical target rate of 30%. This is helpful for dealerships to evaluate the effectiveness of their digital attribution and identify gaps in data resolution that could affect marketing strategies.
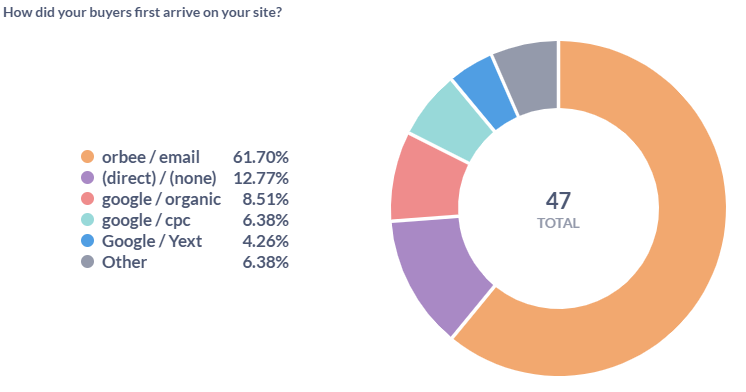
How did your buyers first arrive on your site?
Break down of the first-touch sources that brought buyers to the site. Dealerships can use this data to evaluate which marketing channels are most effective in generating initial engagement and tailor their acquisition strategies accordingly.
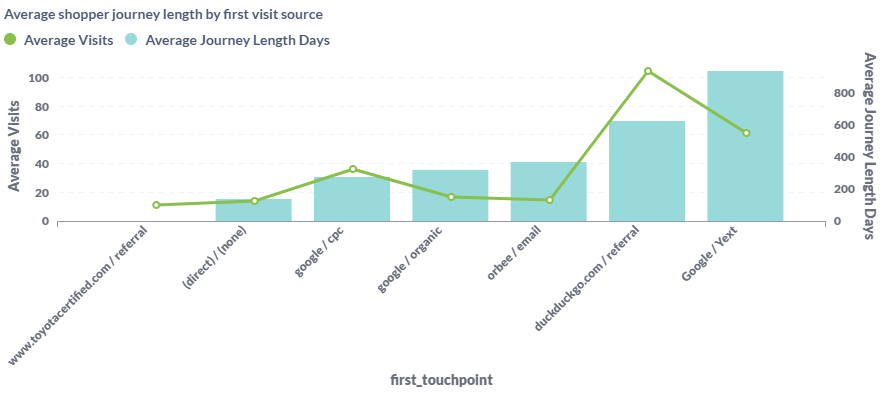
Average shopper journey length by first visit source
This bar and line graph displays average journey length (in days) and visits by the first-touch source medium. This helps dealerships analyze how long shoppers take from first visit to conversion and identify which sources lead to longer or shorter paths to purchase.
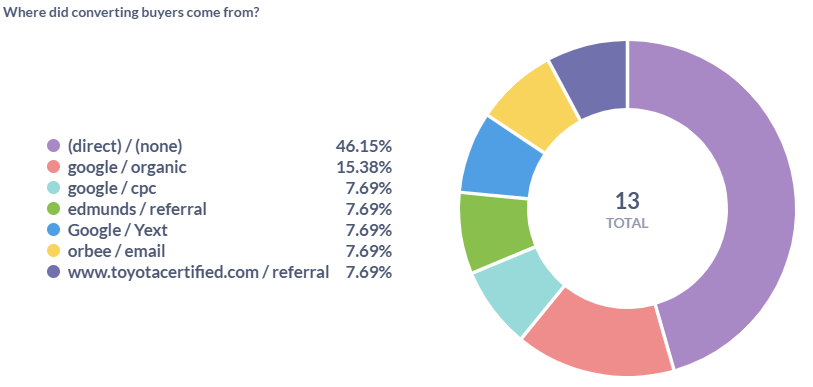
Where did converting buyers come from?
This chart shows the source medium for buyers who completed a conversion. Dealerships can use this data to optimize marketing strategies by focusing on the most effective channels for driving conversions.
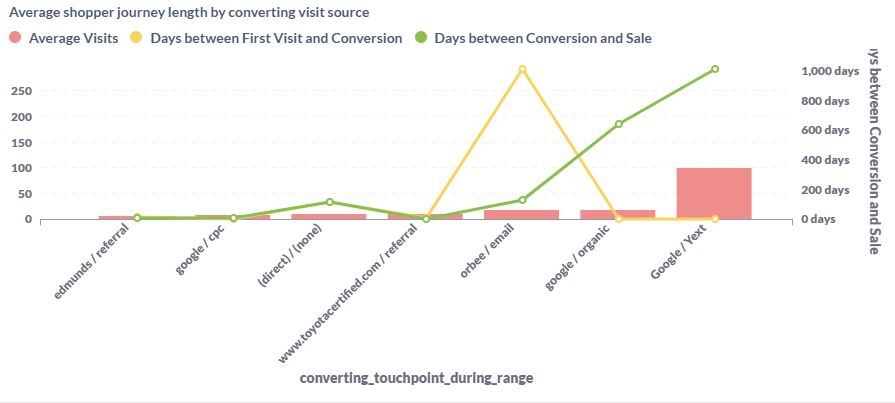
Average shopper journey length by converting visit source
This graph tracks the journey length (in days) and visits for buyers from their first visit to conversion and the time from conversion to sale. This information allows dealerships to assess the effectiveness of specific touchpoints along the shopper journey and optimize marketing efforts accordingly.
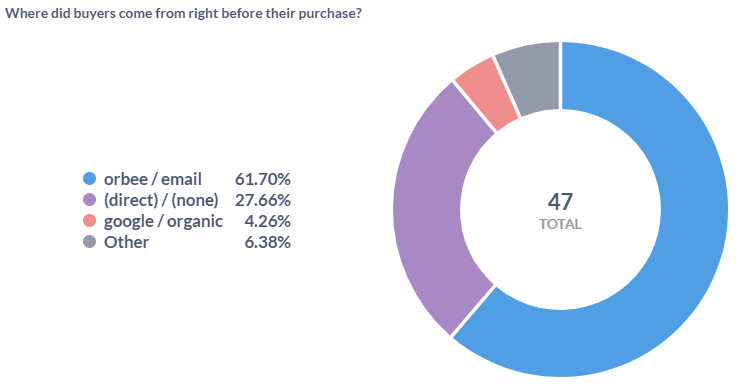
Where Did Buyers Come From Right Before Their Purchase?
This chart shows the traffic source immediately before the purchase. Dealerships can use this information to evaluate the final touchpoint that influenced the sale and understand the role of last-minute touchpoints in driving conversions.
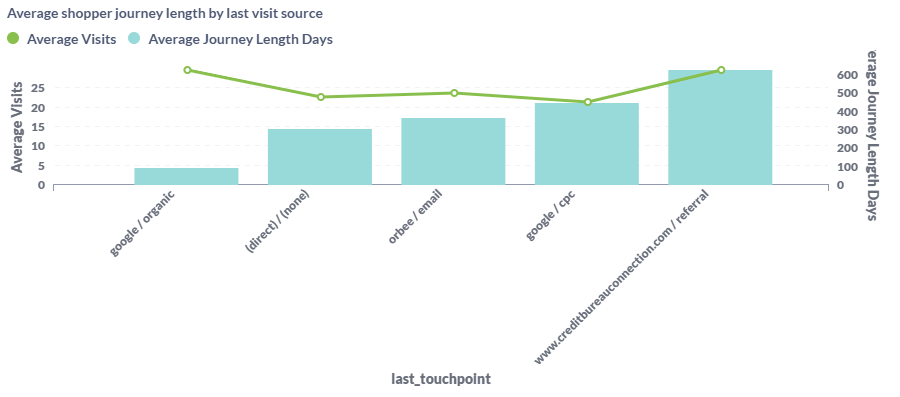
Average Shopper Journey Length by Last Visit Source
This bar and line graph presents average journey length and visits based on the traffic source before purchase. By understanding where buyers are coming from right before they purchase, dealerships can optimize the timing and targeting of their last-touch marketing efforts.
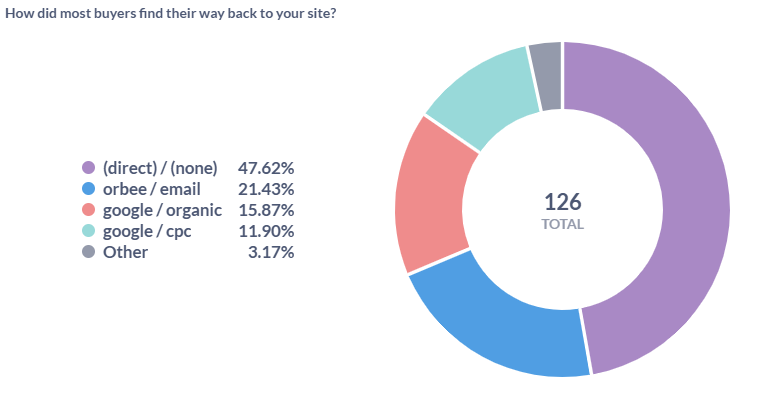
How Did Most Buyers Find Their Way Back to Your Site?
This chart displays the sources that brought the most returning buyers to the site. Dealerships can use this to fine-tune their remarketing strategies and ensure that their re-engagement efforts are focused on the most effective channels.
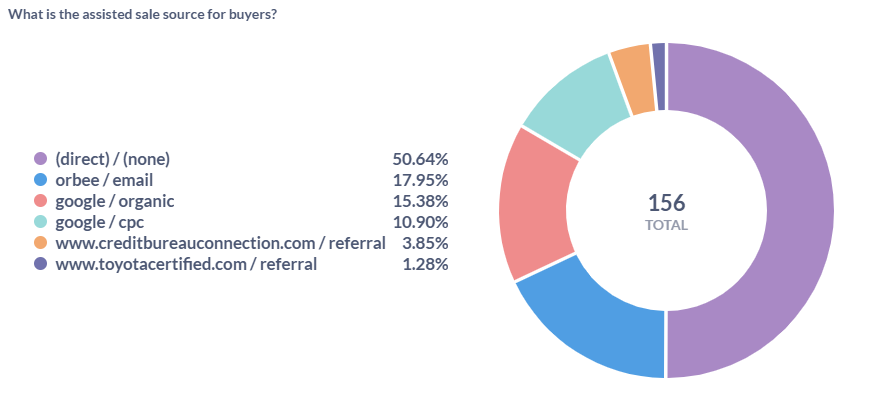
What is the assisted sale source for buyers
This Orbee-defined metric identifies the sources within 10 days before a sale, considered to be the most likely contributors to the purchase.
Buyer Visit URLs
These charts shows the landing pages (URLs) where buyers first visited, last visited, and converted. By analyzing the most popular landing pages, dealerships can optimize those pages for higher conversions and ensure they are providing the most relevant content to potential buyers.
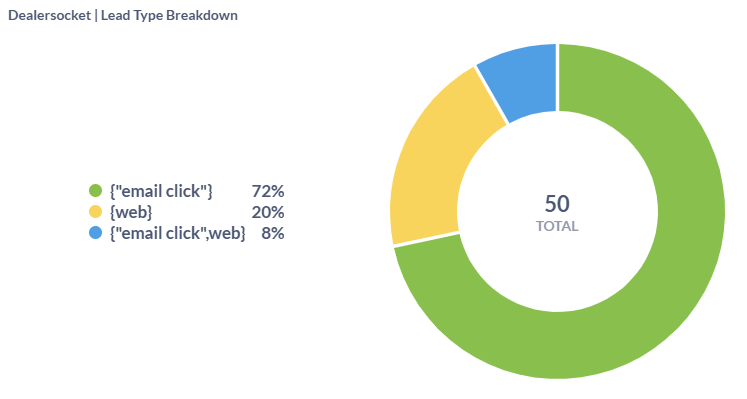
Lead Type Breakdown
This chart shows the distribution of lead types based on CRM data, such as email clicks, web form submissions, or third-party ads. This helps dealerships understand which lead sources are most effective and where their best leads are coming from.
Sold Shoppers Attribution Table
This raw data table can be exported and allows for further analysis of the performance of various sources and touchpoints for sold shoppers, making it ideal for sales or business analytics teams to dive deeper into attribution data and optimize the customer journey.