
‼️Because of the size of the data being pulled, there can be delays in load times for the report. Multiple refresh attempts may be necessary in these cases.
View the Report
- Sign in to Orbee
- From the top menu, select Analytics
- On the left, scroll down to Dashboards and select Traffic Overview
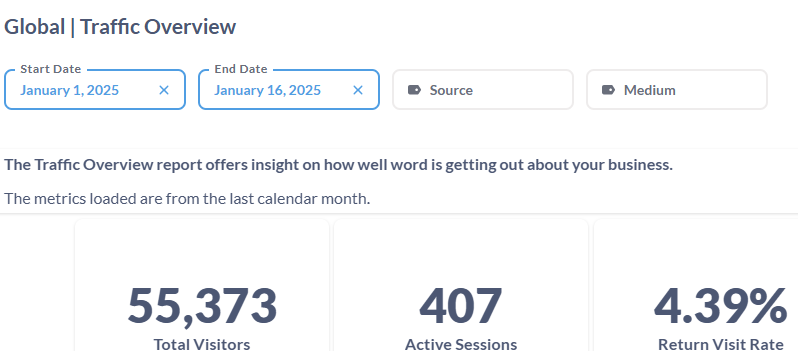
The report is filterable by a specific date range. However if none is selected, it will load the last calendar month (i.e., if viewing on February 14, 2025 - it will load metrics from January 2025).
You also have the option to filter by a specific source or medium for a more granular view.
Where the data comes from
The Traffic Overview is sourced from Orbee First Party data or website data. This is the data that is collected via the Orbee script that is injected onto your website and within (vendor-approved) digital retailing tools and iframes.
‼️It’s important to ensure that all expected traffic sources are tagged properly for accurate reporting. Most sources will have auto-tagging features available, but it’s good practice to check with your partners to ensure proper tagging even in manual tagging cases.
Traffic Summary Dashboard
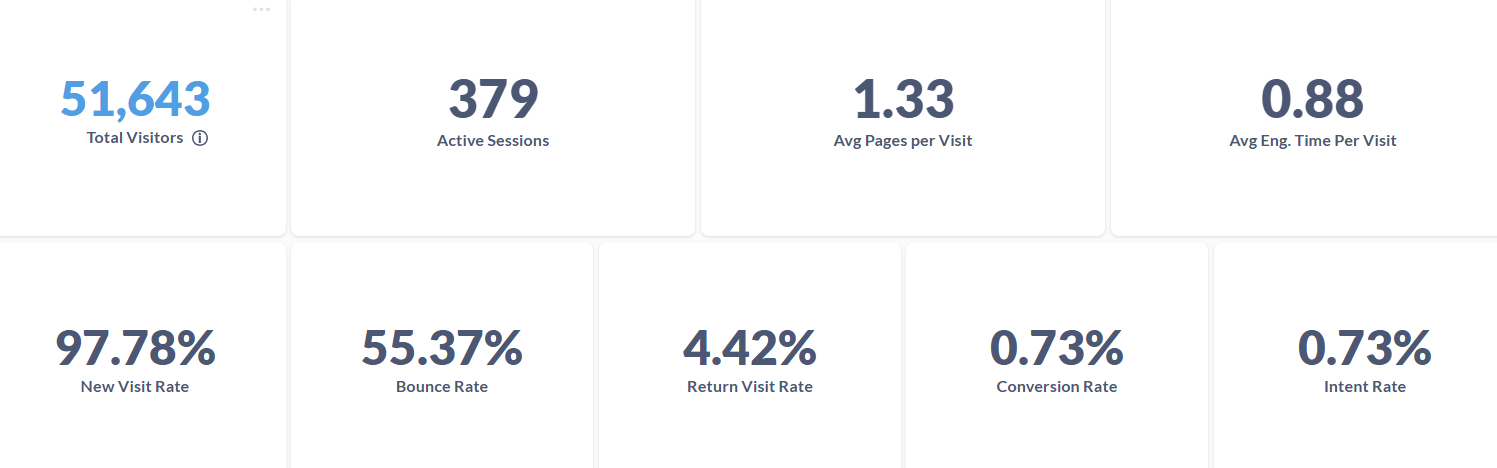
The summary dashboard provides callouts of significant metrics related to website traffic.
Total Visitors: Tracks overall website reach and awareness.
- Provides insight into brand visibility and marketing effectiveness; the expected benchmark for mid-sized dealerships is about 10,000+ monthly visitors.
Active Sessions: The total number of visitors who have intent to purchase based on certain engagement activities and events (i.e., view vdp, submit form, etc.,)
- Typically aligns with website experience and campaign activity.
Avg Pages Per Visit: Reflects user interest and ease of site navigation.
- The benchmark is 4-6 pages per visit.
Avg Engagement Time Per Visit: Highlights user interaction with the site.
- A good benchmark is 2-4 minutes on average.
New Visit Rate: Measures success in acquiring a new audience.
- The benchmark is 60-70% new visits.
Bounce Rate: Reflects content relevance and user experience.
- The goal is to keep it under 50%.
Return Visit Rate: Demonstrates ongoing buyer consideration.
- The expected rate is 30-40% return visits.
Conversion Rate: Directly ties to lead generation and sales potential.
- Benchmarks are 2-3% for forms and 5-10% for VDP views.
Intent Rate: Highlights users signaling high purchase intent.
- The typical benchmark is 10-20%.
Traffic Quality at a Glance
The following dashboard offers insight on the quality of your traffic.
What’s the quality of your visits?

Reviewing probable live and bot traffic ensures accurate analytics, protects data integrity, and prevents skewed metrics, allowing better focus on real customer engagement and conversions.
Where are your visitors coming from?
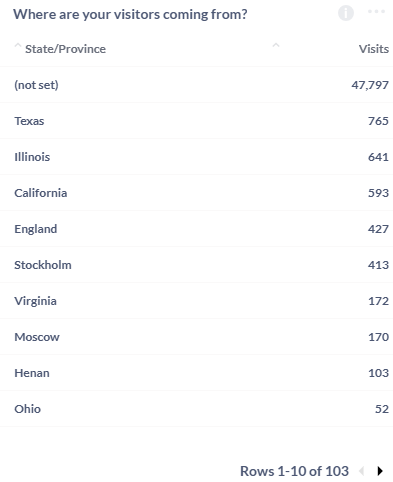
Tracking visitor locations (e.g., state and number of visits) helps identify target markets, optimize regional campaigns, and align inventory with demand.
What devices are people using?
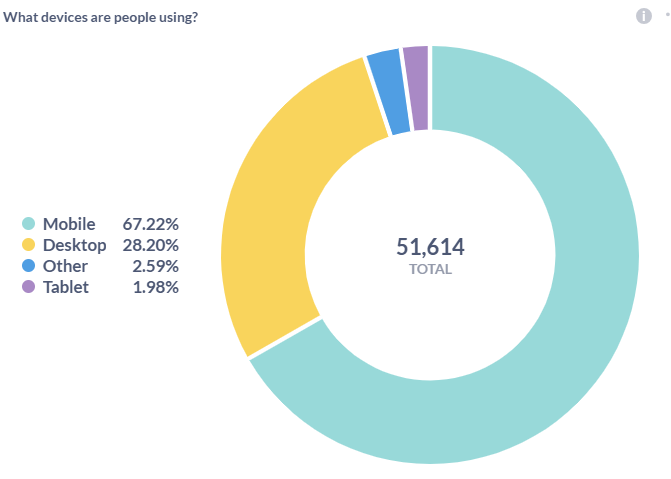
Monitoring device distribution (e.g., mobile, desktop, tablet) ensures your site is optimized for user preferences and delivers a seamless experience across platforms.
Top Channels by Visits
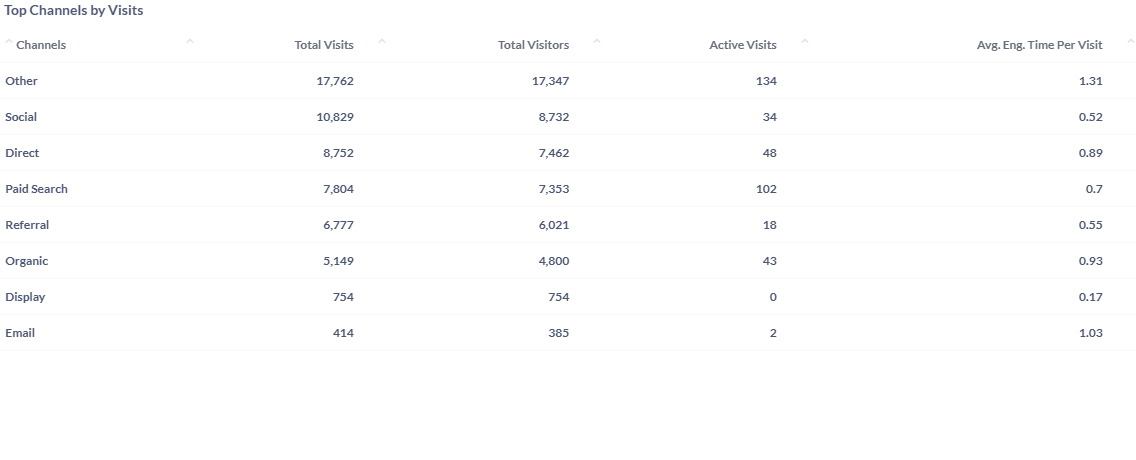
Analyzing channel performance (e.g., visits, engagement time, intent, conversions) identifies high-performing marketing strategies and areas for improvement.
This table can be exported by hovering your cursor to the top-right most corner of the table (above ‘web-price’) and clicked on the horizontal three dots to expand the export options list. Once you select an option, it will download to your local desktop.
Top Source Medium by Visits
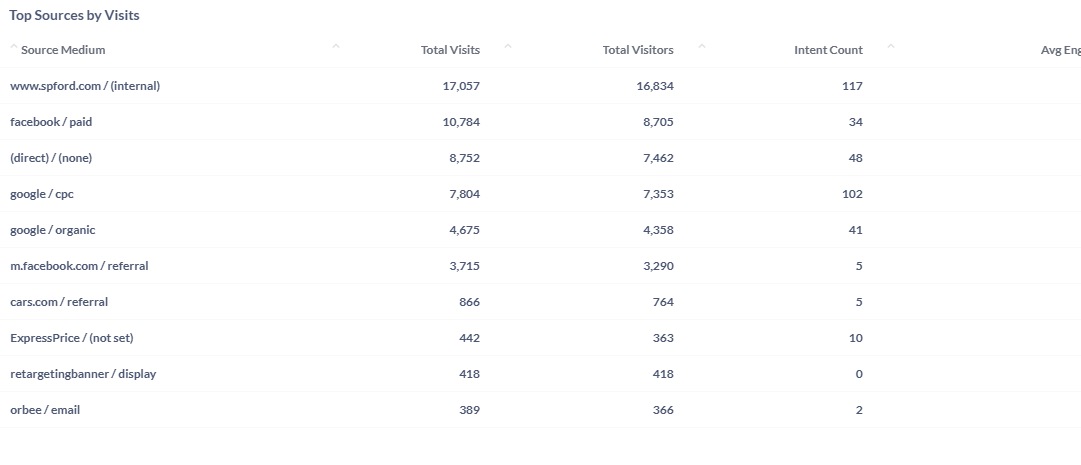
Reviewing source mediums (e.g., referral, organic, paid) highlights key traffic drivers, enabling better budget allocation and campaign adjustments.
This table can be exported by hovering your cursor to the top-right most corner of the table (above ‘web-price’) and clicked on the horizontal three dots to expand the export options list. Once you select an option, it will download to your local desktop.
Top Viewed Vehicles
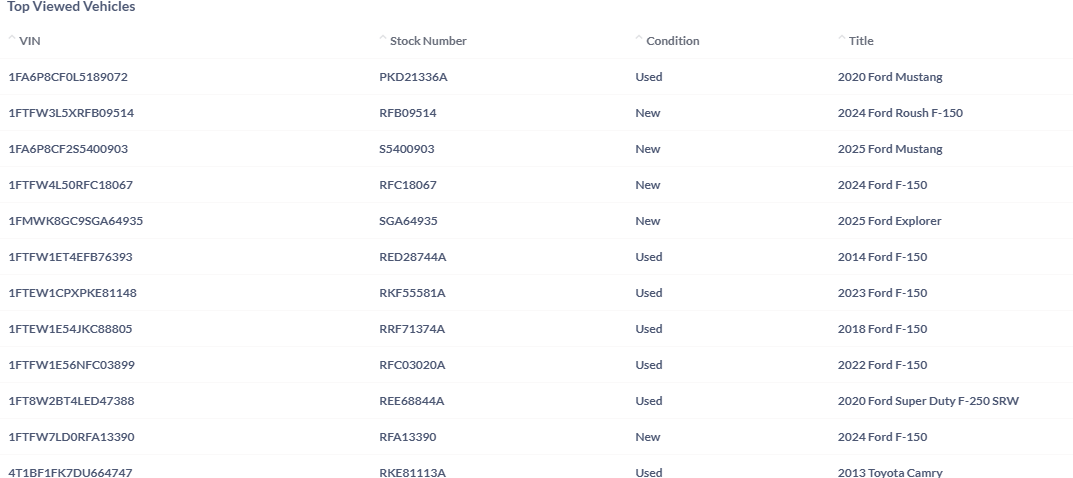
Tracking vehicle views (e.g., VIN, stock number, condition) reveals customer interest trends, helping prioritize inventory and promotional efforts.
This table can be exported by hovering your cursor to the top-right most corner of the table (above ‘web-price’) and clicked on the horizontal three dots to expand the export options list. Once you select an option, it will download to your local desktop.