
This report is ideal for dealerships that do not have CRM integration, as it offers insights into how visitors arrived on the site, how they navigated, and whether they converted. The data covers the last 30 days, helping dealerships understand the performance of various marketing sources and refine their strategies to increase conversions and improve engagement.
View the Report
- Sign in to Orbee
- From the top menu, select Analytics
- On the left, scroll down to Dashboards and select Visitor Attribution Report
Where the data comes from
The Leads Overview report is sourced from Orbee First Party data or website data. This is the data that is collected via the Orbee script that is injected onto your website and within (vendor-approved) digital retailing tools and iframes.
‼️It’s important to ensure that all expected traffic sources are tagged properly for accurate reporting. Most sources will have auto-tagging features available, but it’s good practice to check with your partners to ensure proper tagging even in manual tagging cases.
Customer Journey - Converting Shoppers
The first three dashboards follow the shopper journey of those visitors who have performed a conversion on your website.
How did customers first arrive on your site?
This chart displays the distribution of traffic sources from first visits, allowing dealerships to identify which channels are most effective in driving initial traffic and where marketing efforts should be focused to attract more qualified visitors.

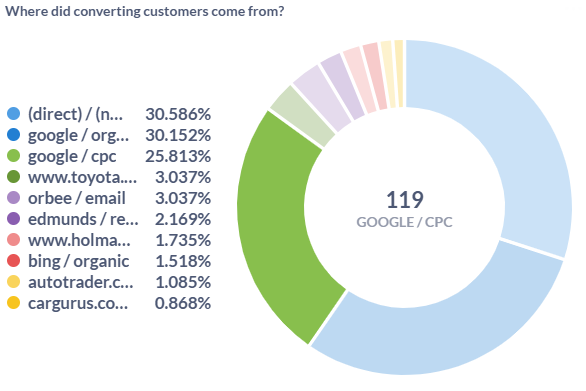
Where did converting customers come from?
This chart shows the traffic sources for users who converted, helping dealerships assess which channels are directly leading to conversions and informing decisions on where to allocate more marketing resources for higher conversion rates.
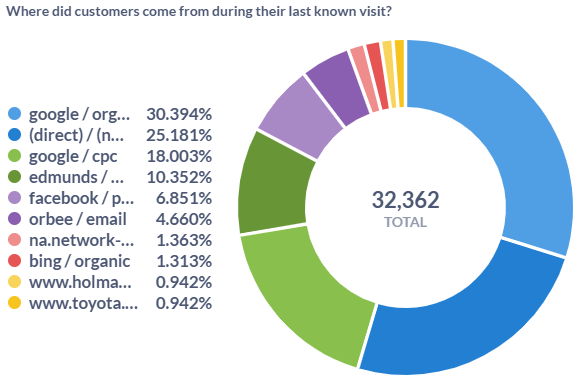
Where did customers come from during their last known visit?
This chart shows the source of the last known visit for each shopper, providing insights into how customers returned to the site and which touchpoints are most effective in re-engaging visitors.
Customer Journey - Non-Converting Shoppers
The next two dashboards explore the journey of shoppers who did not perform conversions on your website.
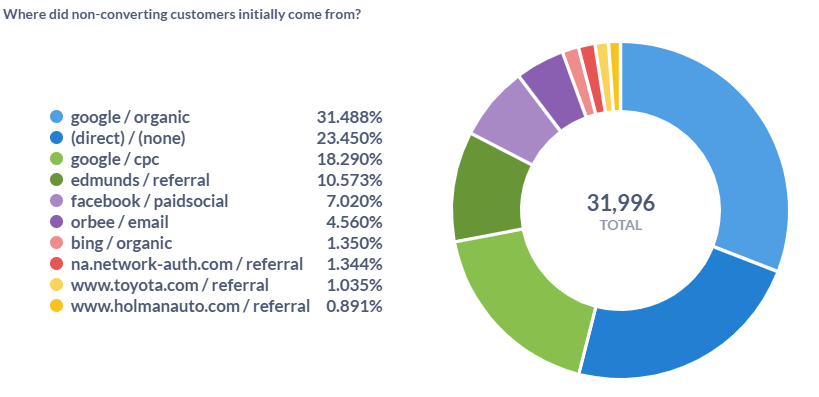
Where did non-converting customers initially come from?
This chart shows the initial sources for visitors who did not convert, helping dealerships understand the channels that may need further optimization or additional efforts to convert these users.
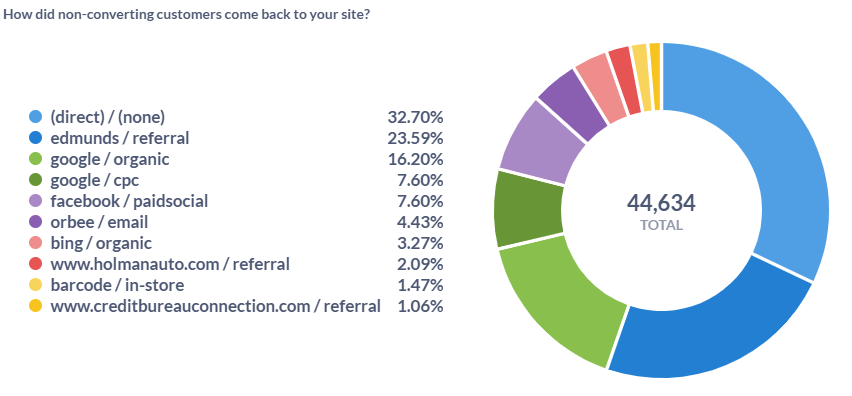
How did non-converting customers come back to your site?
This donut chart reveals the sources that brought non-converting shoppers back to the site, allowing dealerships to refine remarketing strategies and better target visitors who have shown interest but haven't yet converted.
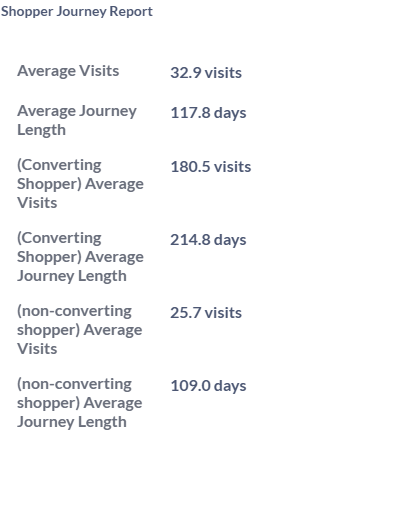
Shopper Journey Report
This chart offers metrics such as average visits and average journey length (in days) for both converting and non-converting shoppers.
Dealerships can have a clearer view of the customer journey and insights into engagement levels.
It helps identify the touchpoints where customers may drop off and adjust strategies accordingly.
All Visitor Attribution - Last 30 Days
This raw exportable table provides detailed visitor data, which can be used for in-depth analysis by sales or business teams to better understand the performance of various traffic sources and optimize marketing strategies based on customer behavior.